When considering page speed, the SI (Speed Index) on the first screen is an interesting indicator. It is definitely an indicator of your page performance, but it is completely different from other user-centric metrics such as First Contentful Paint and Largest Contentful Paint. SI indicates the speed at which your website loads the first screen. Or, in other words, when everything in the user viewport is fully visible. When viewing the loading time of a page, you are less likely to be punished or rewarded for the average display on the first screen. This is no reason to ignore it. As a single indicator, it is one of the few indicators that contain multiple other indicators, giving you a comprehensive understanding of the overall speed, efficiency, and performance of the site.
what is the average value of the first screen display?
Lighthouse is the backbone of Google PageSpeed Insights, which looks at multiple performance metrics to rate your site. The first screen display average (SI) is one of them, and the report will show time in seconds rather than milliseconds like some other metrics. Google defines SI as “the speed at which page content is visible to fill”.
is very direct, isn’t it? The average display of the
first screen does not take into account back-end scripts or other non-rendering loads. But they do affect it. SI simply measures how long it takes a user to fully view your content. While other metrics, such as LCP, are measured when displaying the largest portion of the content, the average of the first screen display takes into account any and all of the content that should actually be displayed.
this is not a measure of overall page speed. This takes into account when the browser renders all the elements. Includes invisible scripts and elements that affect performance. However, if you want to be a good measure of when the user thinks the page is fully loaded, SI is the indicator to observe. Because of how user-centric it is, SI can be a good indicator of the overall health of the site, and can also be used as a benchmark for the site’s user experience (UX). How
measures the average of the first screen display
, like most website performance metrics, one of the most commonly used tools is Google’s own PageSpeed Insights. This tool is also one of the most special tools in the results it returns. Even the most perfect site, it is relatively picky. PageSpeed Insights most often provides laboratory data for your website based on aggregate data collected over the past 28 days. However, if you have enough visitors to forward the information back to Google through Chrome, you can also get real measured data from the report. However, not every website can get this.

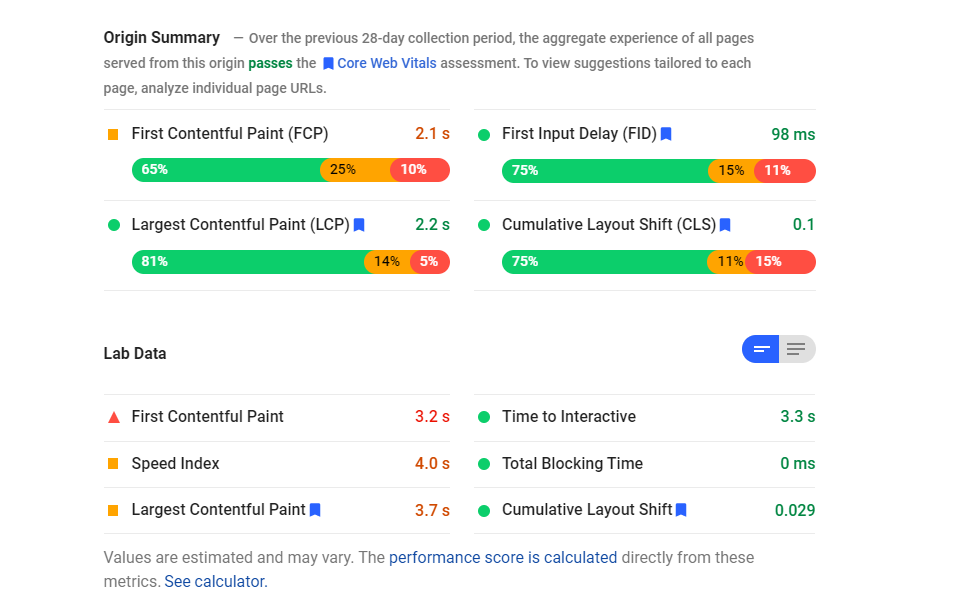
as you can see, the speed of many of these metrics is green. This shows that they are “good”. This is obviously where you want your website. However, the average display on the first screen is 4.0 seconds and orange. Users have to wait a long time to see all the contents of the first screen.
, what is the first screen to show the average score is excellent?
PageSpeed Insights uses the following scores to rank the average of your site’s front screen display and color code it accordingly:
- green (good)-0 to 3.4 seconds
- orange (medium)-3.4 to 5.8 seconds
- red (slow)-more than 5.8 seconds
as we said earlier, PageSpeed Insights is very important in its measurements. If you are in an orange or red state, you may need to use a tool of a speed test class such as GTmetrix or Pingdom to see what its real-time data displays. We think it is best to test your website with a variety of tools at different times to get the best overall performance map.
how to optimize the average score of the first screen presentation
you can take several steps to optimize your average score of the first screen display. If you have tried to optimize your site to improve (or technically slow down) your page speed, you may also have affected your SI score in some way. We will show you some ways to target your SI time so that your page loads as soon as possible, thus providing the best experience for your visitors.
reduces rendering blocking resources
more specifically, reducing JavaScript execution time is one of the best ways to improve the average score of the first screen display. Render blocking resources are scripts and code that first prevent the rest of your site from loading. Unlike the site that loads different elements at the same time, some elements pause all others until they are complete.
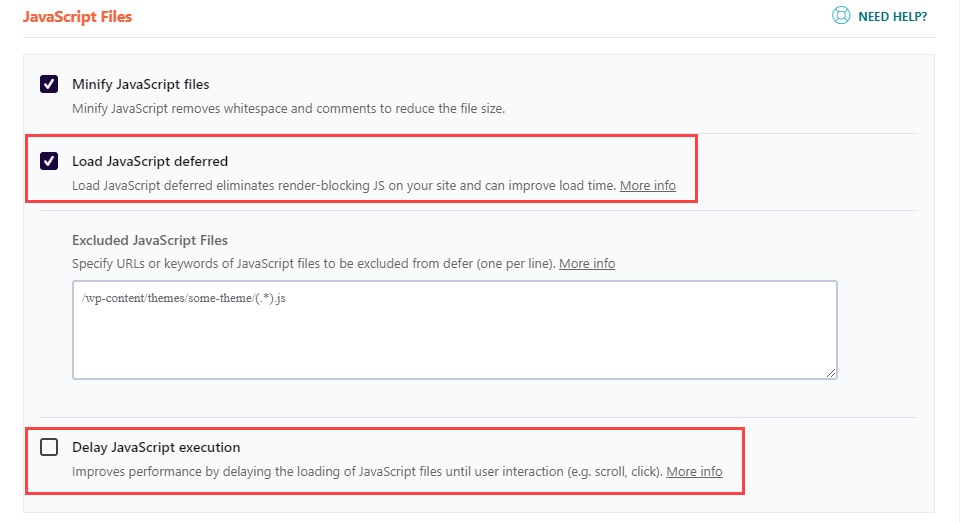
this will reduce the average of the first screen display on your site. To solve this problem, you can postpone loading any number of scripts and code bits until the visible elements are drawn to DOM. Identifying the culprit is actually relatively easy because you can use the Chrome development tool to view your site as it loads, which will indicate what prevents elements from rendering.
in addition, WordPress users can use caching plug-ins such as W3 Total Cache or WP Rocket (or site optimization plug-ins) to handle this issue. Usually these plug-ins have a simple switch to delay rendering blocking resources.

reduces the work of the main thread of a website
like rendering blocking resources, you can limit the performance of your site by loading different elements that take up a lot of the server’s processing power. Reducing these can help push the site to the browser faster.
The simplest solution to this is to stop using so much JavaScript. As GTmetrix said:
in general, the more JavaScript a page has, the longer the parsing / compilation process will take, resulting in a longer wait time for users to view content and interact with your page.
, we realize that this may not be easy. You have designed the site to run in some way. However, you may delete unused code, and you can optimize any third-party JavaScript that is loaded into the site. In addition, JavaScript is greatly simplified.
on top of JS audit, make sure your CSS and HTML are greatly simplified. This will relieve more pressure on the main thread. Caching and optimization plug-ins usually have these options as well. Average value of
first screen presentation FAQ
first screen display average is a simple concept with complex effects. We’d like to answer some frequently asked questions about SI to help you optimize your website as much as possible. How does
SI affect the overall performance of a website? As a single indicator, the average of
‘s first screen shows the performance of your site in many different areas. Because it takes into account fully visible first screen content, you can use it not only as a measure of user perceived load, but also as a rough estimate of your site’s performance in many different areas.
doesn’t actually give you a lot of information about what your site is doing. It can be seen as an all-inclusive indicator, and as GTmetrix puts it, it is “a useful overall benchmark for evaluating the overall performance of your site.” Does
need to pay too much attention to SI scores? While
is useful for benchmarking your site, it is more important to focus on other more subtle issues, such as first content rendering (FCP), maximum content rendering (LCP), first byte time (TTFB), and first input delay (FID). You can take any number of steps to improve these steps individually, thereby increasing the average value of your first screen presentation. When used as an overall benchmark, you can see how your optimization works through SI.
summary
page speed optimization is a never-ending battle for website owners. You must strike a balance between availability, experience, and performance, which can be difficult to find. When the test returns so many different scores on so many different elements, it can be difficult to know where to put your energy and resources. The average display on the first screen can help solve this problem, as a single indicator of your site’s performance as you adjust other more specific parts of the site’s performance.

