
Each web page consists of dozens or hundreds of elements. These include text, images, buttons, gadgets, and so on. Each element varies in size, and the maximum call tells you a lot about optimizing your site using a metric called maximum content rendering (LCP).
Confused about how to improve the maximum content rendering on your site? Or are you not sure what Largest Contentful Paint means and why you need to care about it in the first place?
No matter where you start, this article is for you, because you will learn all about Largest Contentful Paint.
This includes what Largest Contentful Paint means, why it is important, how to measure it, and how to improve it.
In this article, we will explain the concept of LCP (English full name Largest Contentful Paint). We will also show you how to measure this data point and interpret the results. Finally, we will discuss how to optimize your LCP score.
What is maximum content rendering (LCP)?
On most web pages, there is one element that distinguishes it because of its size and prominence. For example, consider this landing page, where the Big Mac Banner section dominates the viewports:

The Big Mac Banner section represents the maximum content rendering (LCP) for this particular page. In other words, LCP is the time it takes for a website to render the elements that contain the most content.
If you want to find out the LCP of this page, you need to measure the time it takes to load the hero section. In theory, if you have a low LCP score, it means that your site is well optimized and can be loaded quickly for users.
It is important to understand that LCP scores may (and hopefully will) differ from the overall load time of your site. You may have a page that takes 3 seconds to fully load, but its LCP may only be 2 seconds. This is because most modern websites also load scripts on top of text and media files.
Typically, LCP goes hand in hand with First Contentful Paint (FCP). This is an indicator that tells you how long it takes to render the first element of any content when someone visits your site. Combined with these metrics (or Google’s Core Web Vitals), you can learn more about the performance of your site than the overall load time.
Keep in mind that Google does not take into account all the content when measuring the LCP of your site. It ignores elements such as scalable vector graphics (SVG) files and videos, but these elements may be included in future updates of Google’s Core Web Vitals.
Largest Contentful Paint is a performance indicator that measures the loading time of the main content of a web page.
Largest Contentful Paint, like Cumulative Layout Shift (CLS) and First Input Delay (FID), is part of Google’s core web metrics.
On a more technical level, Max content measures the time it takes for the user to start loading the page and render the largest block of text, image, or video in the viewport.
What does “main content” mean in terms of LCP?
Well, the main content will depend on the actual page, but it could be any of the following:
- Text-more specifically, any block-level element that contains text nodes or other inline text elements.
- Image-
An element within an element or an element within an element.
- Video-any
Elements with background images-only when loaded through the CSS url () function (it does not apply to CSS gradients).
What’s the difference between LCP vs FCP?
A common problem you may have is the difference between Largest Contentful Paint and First Contentful Paint, which is another common performance metric.
Although the two terms are similar, the key difference is that Largest Contentful Paint measures the time it takes to load the “main content” of the page, while First Contentful Paint measures the time it takes to load the “first object” (whether it is the main content or not).
Basically:
- LCP= is only the main content
- The first part of FCP= content, no matter what it is.
As a result, LCP time is almost always slightly higher than FCP time, because the “main content” element is not usually the first to load.
Why is the maximum content drawing time of the site important?
There are two main reasons why the Largest Contentful Paint time of your website is important.
- User experience
- Search engine optimization
User experience
The biggest reason you should be concerned about your site’s maximum Contentful Paint time is that this metric is a good proxy for understanding your user experience when it comes to your site’s performance.
Most users don’t care how long it takes for your site to fully load each script and element. Instead, what they care about is how long it will take them to start getting value from your site.
Largest Contentful Paint makes a good attempt to measure that “value” moment by looking at the loading time of the main content.
If you optimize your site to achieve fast Largest Contentful Paint time, you can be confident that you provide a solid experience for users on your site, at least in terms of performance (you also want a customer-friendly design and good usability).
Of course, this doesn’t mean you should ignore other performance metrics, and we always recommend a comprehensive review of your site’s performance and bottlenecks.
Search engine optimization (SEO)
In terms of search engine optimization, Largest Contentful Paint is part of three elements of Google’s core web indicators, which Google began to use as a SEO ranking factor in its 2022 page experience algorithm update.
This means that if the painting time of the largest content is not good, it will be a drag on your site’s performance in Google search results.
While other factors, such as content quality / relevance and backlinks, still play a bigger role in your site ranking, it is important to optimize your site’s maximum content painting time to ensure that you get the most out of your SEO efforts.
What factors will affect LCP
Two “main” types of problems can affect the “maximum content drawing” time of a page.
- How long will it take your server to respond to the original HTML document?
- How long it takes for the actual LCP resource to load.
The first type of problem involves server response time, which is the time of the first byte (TTFB). Before the user’s browser can consider loading the main content, it first needs to get a response from the server.
Here are some common questions that affect this.
- Do not use page caching-not using page caching forces the server to do more “work” before responding to HTML documents.
- Slow hosts-slow host vendors will always have a slow TTFB, no matter what you do.
- Without using the CDN- content delivery Network (CDN), you can speed up TTFB by providing pages from its global network, rather than requiring users to download pages from your site’s native server.
After your web server provides the initial HTML document, there may be further bottlenecks when loading the actual main content elements.
Here are some common problems that affect this.
- JavaScript or CSS that hinders rendering (or generally unoptimized / unnecessary code)-if the user’s browser needs to download and / or handle unnecessary JavaScript or CSS before loading the main elements, this will slow down your LCP.
- Unoptimized image-if the LCP element is an image, using an unoptimized image will slow you down because larger images take longer to download.
- Unoptimized font loading-if the LCP element is text, loading custom fonts in an unoptimized manner will make the text appear longer.
- Uncompressed files-if you don’t use compression techniques such as Gzip or Brotli, it will take longer for users’ browsers to download files from your site.
Depending on your website, you may have encountered bottlenecks in both areas, or just one of them. Later in this article, you will learn how to solve all these problems.
What is a good LCP time?
Google defines the maximum content drawing time for “good” as less than 2.5 seconds.
If the maximum content drawing time for your page is between 2.5 and 4.0 seconds, Google classifies it as “in need of improvement.” If your page lasts for more than 4.0 seconds, Google defines it as “bad”.
Here is a graphic provided by Google, which shows this visually.
Recommended LCP time from Google
How to measure LCP
In general, it is easy to determine the largest content element on your site. All you have to do is wait for the page to fully load and look around. In most cases, one part or element is more prominent than other parts or elements. As we mentioned above, it may be the hero part, or it may be the actual article content in the blog.
It is usually an image or a block of text (such as the hero section above or general blog content). LCP also varies from user to user because it is based on their viewport (or first screen content).
The real trick of LCP is to measure how long it takes for a particular element to load. (not the page itself. Fortunately, if you have ever used a tool or service that measures load time, it probably also contains detailed metrics, such as FCP and LCP scores.
For example, consider PageSpeed Insights. You can enter any URL, and the service will perform a complete performance test on the page. In the results, you will see the overall performance score. There are also subdivisions of other indicators under the measured data section, including LCP:
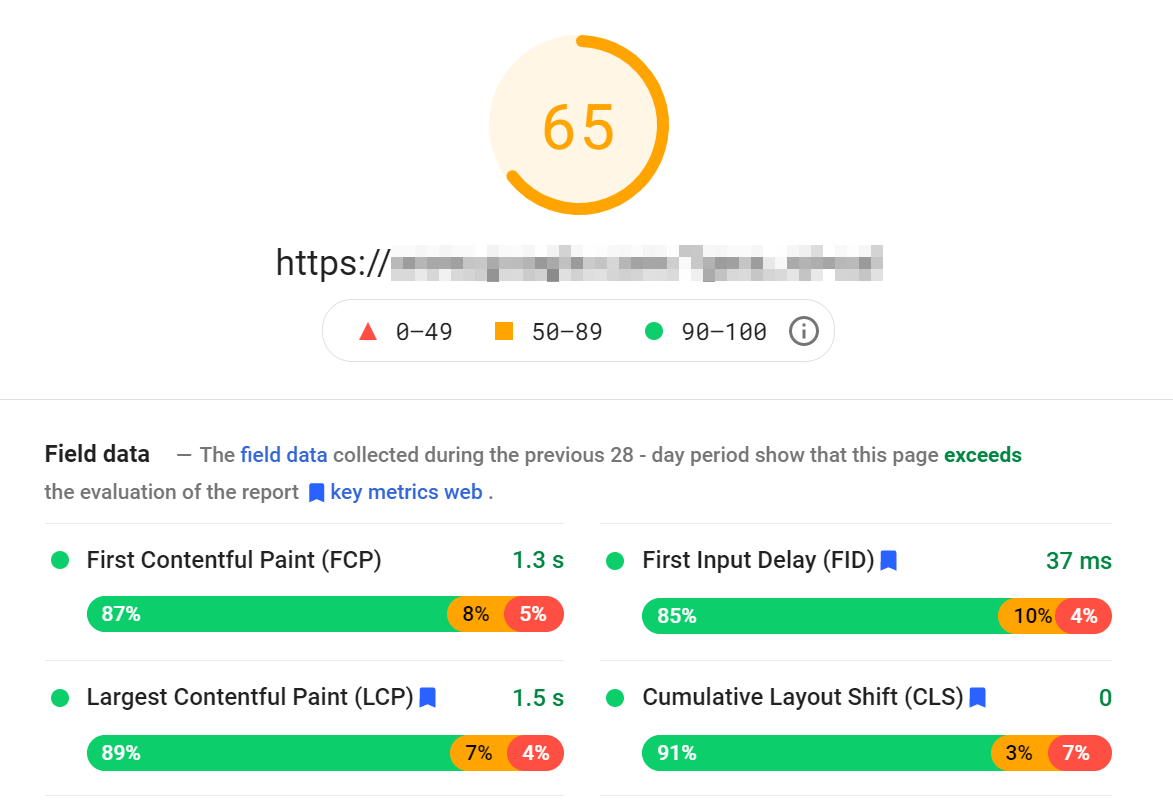
PageSpeed Insights collects real performance data from multiple users and uses it to provide you with aggregate scores over a period of time. This approach is much more accurate than using a single test to determine the performance of your site.
In addition, you can get a percentage breakdown of each score. In the above example, we can see that 89% of the page loads occur within 1.5 seconds, which is an amazing score. However, the remaining 11% of the page loads are not in this range. This means that for some users, LCP takes longer to resolve.
It is important to understand that even if your site is well optimized, the load time will vary from user base to user base. Some visitors may have slow Internet connections or may be too far away from your server. These are just two of the many reasons why loading may take longer in some cases. That’s why it’s important to have an average score as a reference.
If you scroll down the PageSpeed Insights results page further, you will see the lab data section. Here, Google provides you with the exact results of the test it just ran on your web page:
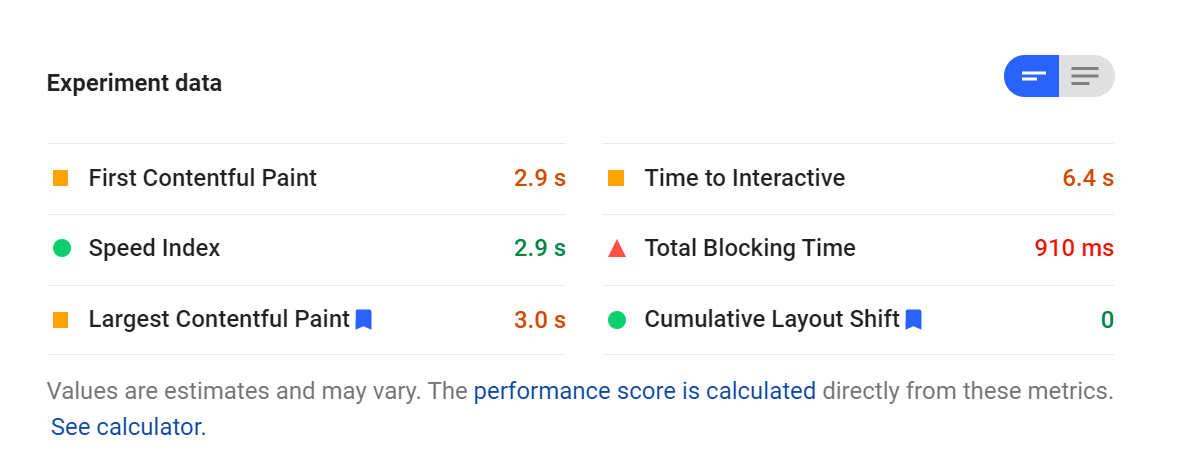
PageSpeed Insights uses this lab data to provide you with the total score you saw at the beginning of the results. Laboratory data can not provide as comprehensive information as the aggregated measured data. However, it can still give you a good understanding of the performance of the website.
Ideally, your LCP score should be less than 2.5 seconds (by contrast, FCP is ideal for 1.8 seconds). The lower the time, the better. To get the best score and experience, your overall load time should be less than 3 seconds. After that, you usually begin to see a significant increase in the bounce rate.
In our experience, PageSpeed Insights is the best tool you can use to measure LCP and overall load time. However, if you set up Search Console for your website, you can also access the same information, which we absolutely recommend for search engine optimization (SEO) purposes.
If you want to see something other than Google, you can also use the browser’s development tools to measure LCP time manually. Most development kits enable you to measure page load time and provide detailed information about the time it takes to load each element and process each request. However, this manual approach involves a lot more work than using third-party services.
You can also use speed testing services such as GT Metrix and Pingdom to see more about LCP and other page load metrics.
Chrome Developer Tools
You can also use the performance tab or its Lighthouse audit function directly from the Chrome developer tools to test Largest Contentful Paint time. We recommend using the “Performance” tab because it provides you with more information.
Here is how to get started:
- Open the page you want to test.
- Open the Chrome development tools.
- Go to the Performance tab.
- Make sure the “Web Vitals” box is checked.
- Click the Reload button (described below).
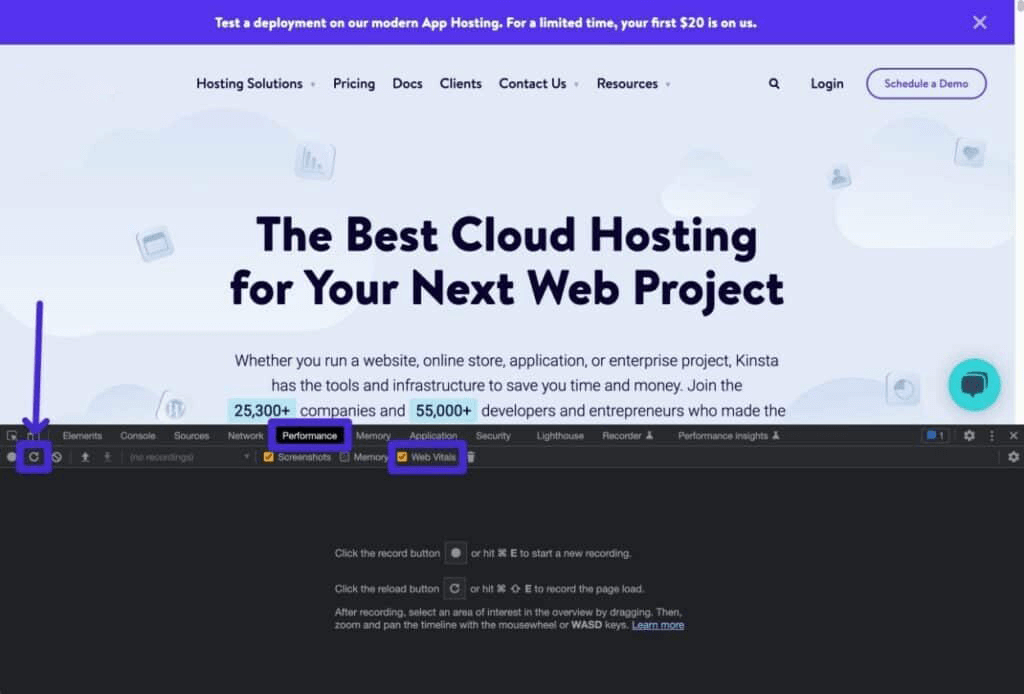
How to run a performance test in a Chrome development tool
Now you should see a comprehensive analysis of your website.
If you hover over the LCP of the Network tab, you can see the time:
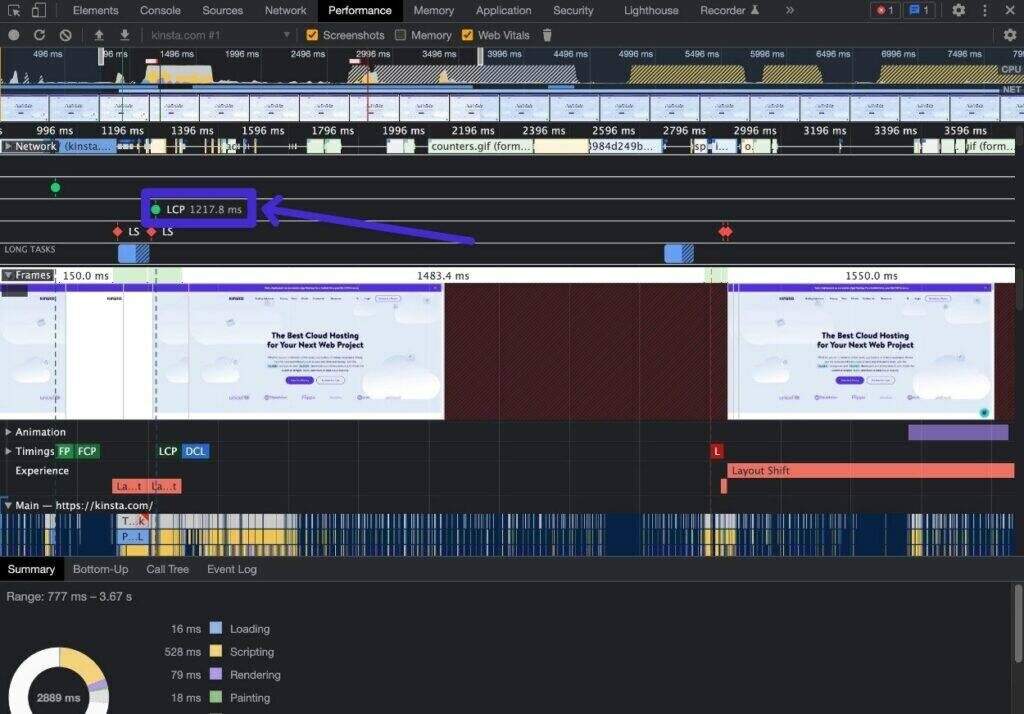
How to view LCP time in Chrome development tools
If you hover over the LCP of the Timings tag, you can see the actual LCP element:
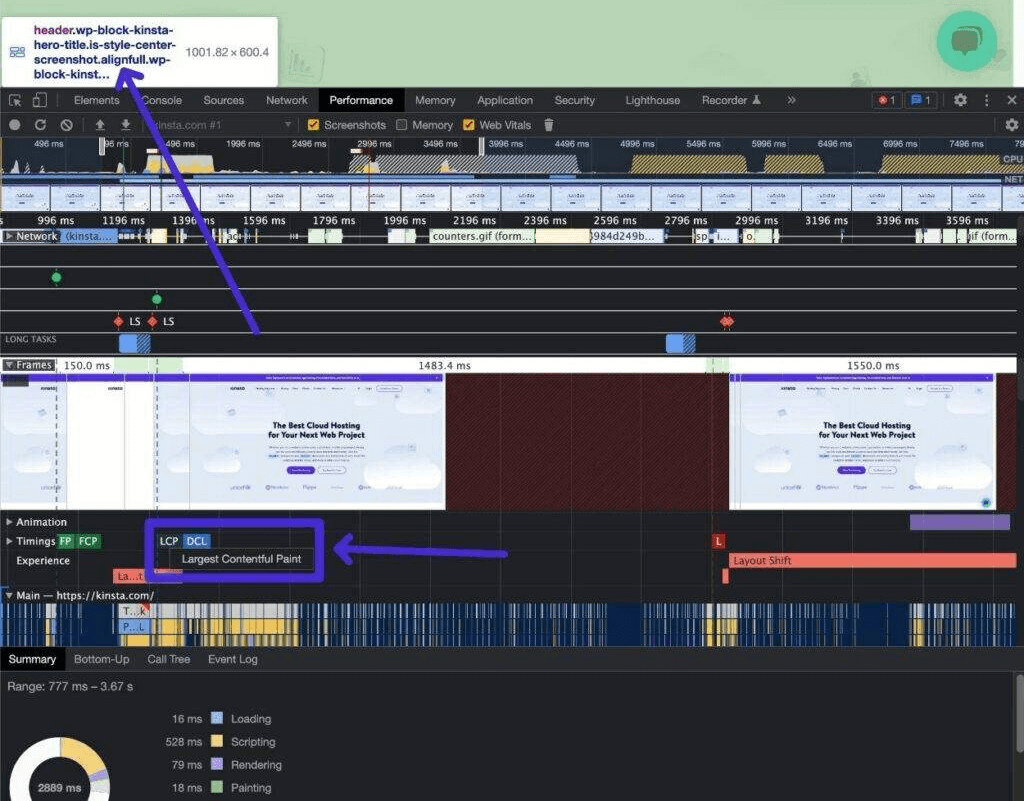
How to view LCP elements in Chrome development tools
Google Search Console
Although Google Search Console does not allow you to test the Largest Contentful Paint time of a single page, it is very useful for evaluating the performance of the entire site.
Every page on your site has a different LCP time, so you can’t just test your home page and then it’s over.
Through the Google search console, you can see the position of each page on your site in Google’s “good”, “need to improve” and “bad” categories. The performance data comes from the Chrome user experience report, so it is based on real user data.
Here is how to access the LCP report.
- Open Google Search Console for your website.
- Under the experience tab, go to Core Page Metrics.
- Click “Open report” next to the mobile or desktop chart.
- Look for any questions in the “reasons why URLs are not considered good URLs”. If you click on the question, you can see more information about which URL is causing the problem.
* be sure to check both desktop and mobile results, as everyone’s data may be different.
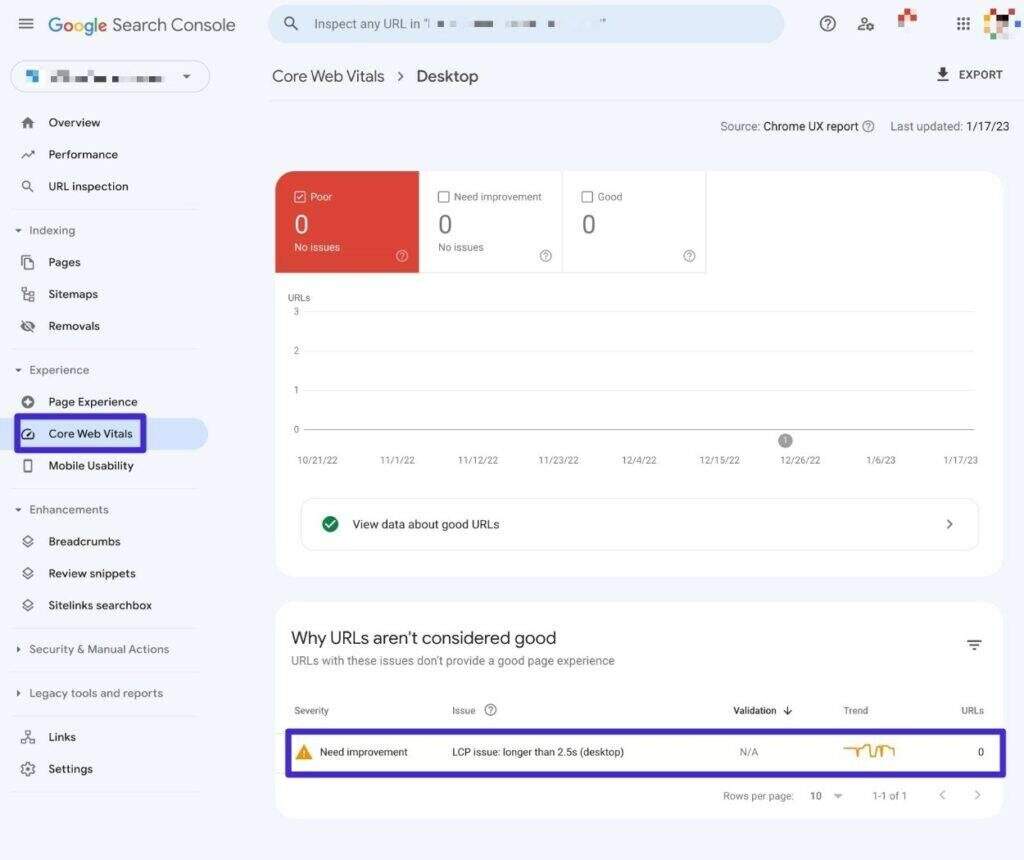
How to see LCP problems in Google Search Console
WebPageTest
WebPageTest is another convenient choice for running simulated performance tests.
Unlike PageSpeed Insights, WebPageTest allows you to completely customize a variety of test metrics, such as test location, connection speed, equipment, etc. This is the main advantage of using it over other tools-it gives you more options to configure tests.
Here is how to run a test:
- Go to WebPageTest.
- Add the page URL that you want to test.
- Expand the Advanced Configuration option to fully configure your tests.
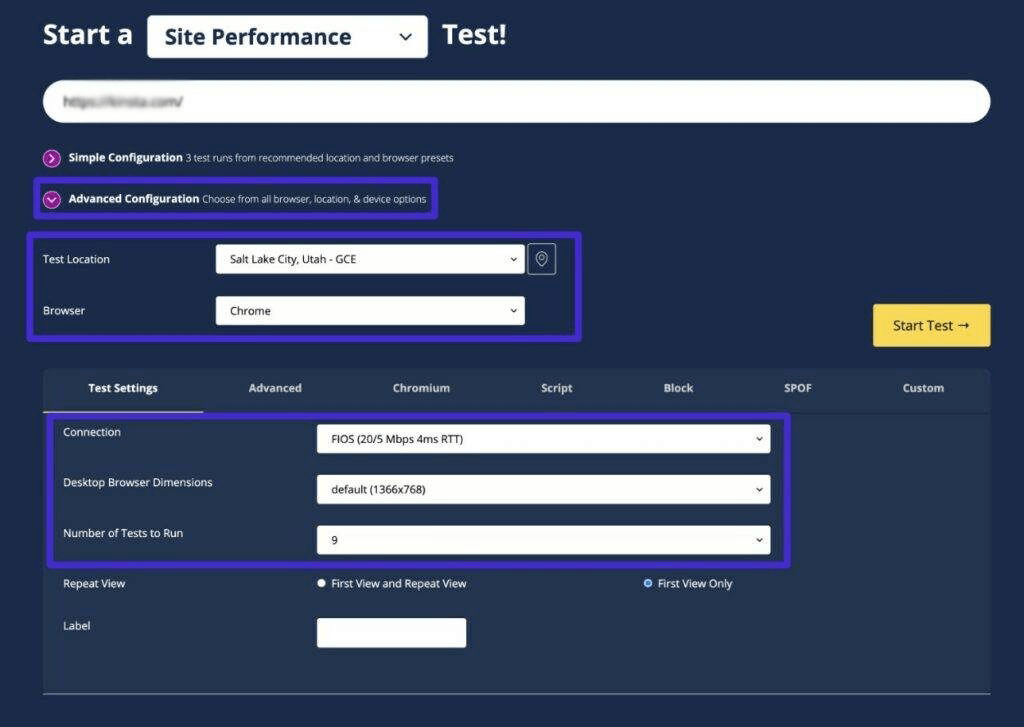
How to test LCP time with WebPageTest
On the results page, you will see LCP data, as well as a number of other performance metrics (including waterfall analysis).
How to optimize the website LCP score
If you can identify the largest element on the page, you should be able to optimize it. For example, if the element is an image, you can always use a compression tool to reduce its file size and increase its LCP score.
However, this method only applies to your site that has not been well optimized. If you have taken steps to improve the performance of your site, you need to consider different ways to optimize its LCP scores.
Based on our experience, you can improve the LCP score of your website through the following most effective optimizations:
- Resize and compress the image. In most cases, the image will determine your LCP score. As a rule of thumb, you should adjust and optimize every image uploaded to the site (consider the image compression plug-in). WordPress 5.8 has become compatible with WebP images, which can help many websites enter the LCP era.
- Choose a better managed service. If you have worked hard to optimize your site, but the load time is still too long, this may be due to your web host. The plan you may be using may not keep up with the popularity of your site, or your virtual host may not be able to provide the performance you need. No matter how much work you put into the site, a reliable hosting plan can succeed or fail.
- Use a content delivery network (CDN). CDN can cache copies of your site on server clusters around the world and provide them to visitors. Some CDN also provide image-specific services, which help greatly reduce LCP scores.
- Eliminate rendering blocking resources. If a resource stops loading elements on your site before execution, the resource is render blocked. Typically, these are the key structures of your site, such as HTML, CSS, and JavaScript. As a rule of thumb, you want to eliminate or defer elements that perform this operation, or force them to run after all other content has been loaded. Many plug-ins, such as WP Rocket, can do this for you by switching.
Now that you know all about Largest Contentful Paint, let’s move on to some actionable tips on how to improve Largest Contentful Paint in WordPress.
Although we will focus on these techniques of WordPress, all of them are generic and can be applied to other types of websites.
Set up caching to improve server response time
Caching can improve server response time by reducing the amount of processing that your server needs to do before sending the completed HTML document to the visitor’s browser.
You can use free plug-ins like WP Super Cache or paid plug-ins like WP Rocket to enable caching on your site.
For more choices, please check out our article, which has the best WordPress caching plug-ins.
Upgrade to a faster WordPress host
While all the strategies on this list can help you improve your LCP time, there is nothing to beat around the bush.
If you use a slow, unoptimized WordPress host, your LCP time will always be limited by the quality of your host.
You may be able to do things better, but if your host is slow, it’s always hard to get less than 2.5 seconds of LCP time.
If you want to improve your Largest Contentful Paint time in the easiest way, you can migrate your site to a hosting service that is optimized for WordPress.
This means that you can focus on developing your site instead of messing around optimizing your Largest Contentful Paint time.
If you’re still hesitant-try the other tips on this list. However, if you are still struggling after doing everything on this list, you may need a better host.
Using CDN acceleration
Without CDN, all visitors to your site need to download the HTML and static assets of the page from your host server.
If your visitors are near your server, this is usually not a problem. However, if your visitors are distributed around the world, this may slow down your site due to the physical distance between your visitors and your website server.
With CDN, you can distribute your site’s static assets (even the finished HTML pages of your site) to CDN’s global network. This allows visitors to download files from the nearest location of CDN, which is much faster.
This means that visitors to your site can download the complete page from the nearest edge, which speeds up both the response time of the server and the loading time of your LCP resources.
If you host it elsewhere, you can use popular CDN services such as KeyCDN, Bunny, StackPath, etc., to set CDN for your site’s static assets.
Avoid rendering blocked JavaScript (delay or delete)
A JavaScript that prevents rendering is a JavaScript that is loaded before your main LCP element, although it is not needed at the time.
By delaying loading the LCP element, it will slow down your LCP load time.
To solve this problem, there are several strategies that can be implemented:
- If possible, remove unnecessary JavaScript.
- Defer loads (actively) JavaScript so that it doesn’t hinder the loading of the main elements of your site.
- Delay loads (passively) JavaScript until the user interacts with your site.
For most people, the easiest way to do this is through plug-ins such as Autoptimize or WP Rocket.
- How to eliminate rendering blocking resources on WordPress
- How to actively postpone parsing JavaScript
Avoid rendering blocking CSS and optimize CSS delivery
Just as unoptimized JavaScript slows down your site, unoptimized CSS can cause the same problem.
In essence, you want to load CSS as little as possible. For the CSS you need to load, you need to load it in the best way. Typically, this means that you load important CSS as early as possible, and defer non-critical CSS until later in the loading process.
If you are not a developer, the easiest way to do this is to use performance tuning plug-ins such as Perfmatters, WP Rocket, or FlyingPress.
For example, WP Rocket provides built-in functionality to delete unused CSS page by page and provide CSS in the best way.
If you want to learn more about how to do all this, please check out our complete guide on how to optimize CSS.
Simplify HTML, CSS, and JavaScript
In addition to the above code optimization techniques, you also need to minimize the HTML, CSS, and JavaScript of your site.
In essence, this is removing unnecessary characters and white space from your site code to reduce its size.
You can use free plug-ins like Autoptimize to minimize your code, or advanced integrated plug-ins such as Perfmatters, WP Rocket, or FlyingPress.
Or, check out our complete code minimization tutorial to learn more. Although this tutorial focuses on JavaScript, you can also use the same methods and plug-ins to simplify other code.
Use server-level compression (Gzip or Brotli)
Server-level compression allows you to use technologies such as Gzip or Brotli to reduce the file size of your site.
For example, the compression technology used by the following example website reduces the file size of the home page by 85.82%.
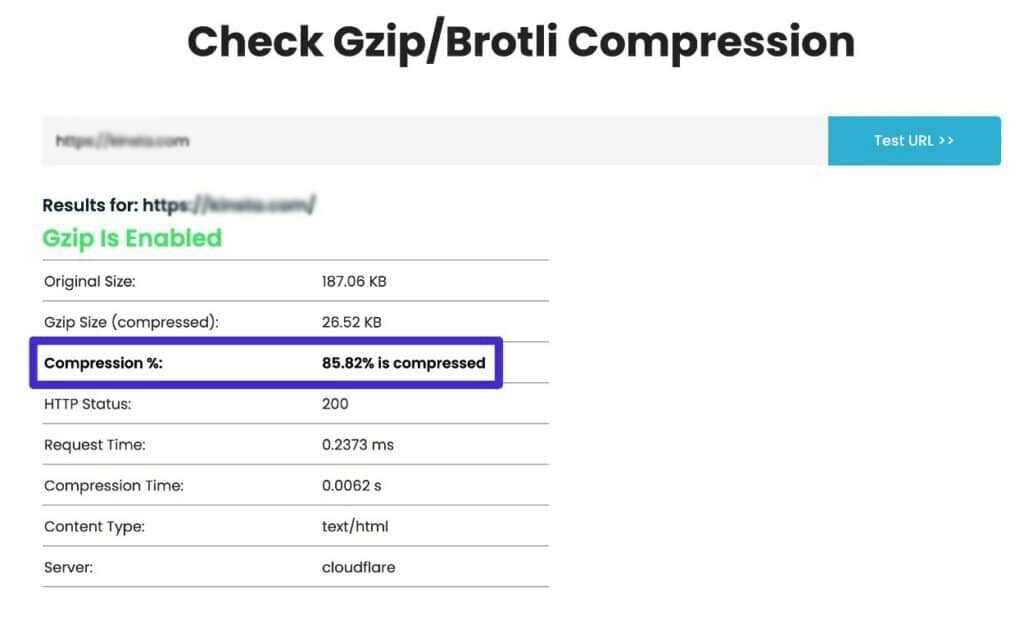
An example of saving file size with Gzip
You can use GiftOfSpeed’s free tool to check whether your site has Gzip or Brotli enabled.
If your site does not use compression, you can follow our guide on how to enable Gzip compression to set it up.
If you use Cloudflare to serve your site’s content, Cloudflare also has a built-in setting to enable Brotli compression:
- Open your website in the Cloudflare dashboard.
- Go to Speed → Optimization in the sidebar menu.
- Enable the Brotli switch.
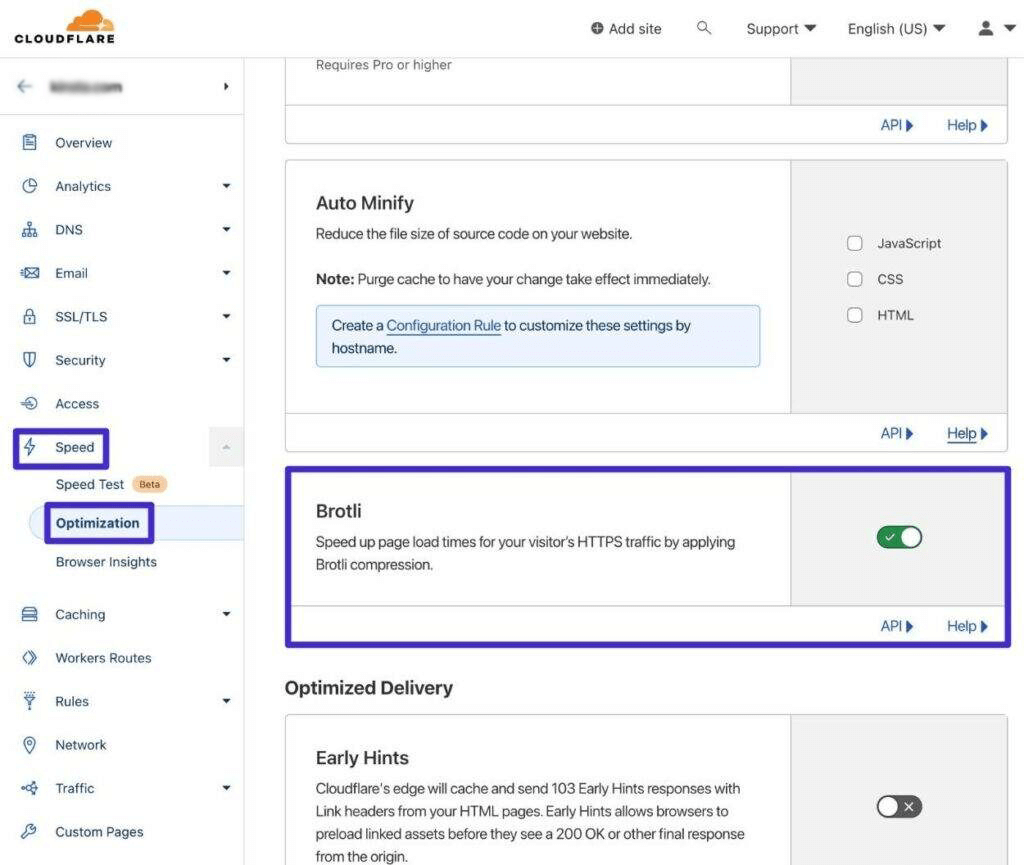
How to enable Brotli Compression in Cloudflare
Compress and resize ima
If your LCP element is an image, finding a way to reduce the size of the image file will reduce the time it takes for the user’s browser to download the image (thus speeding up your LCP time).
To reduce the size of the image, you should resize the image to the size you actually use, compress it with lossy or lossless compression, and provide it in an optimized format such as WebP.
This approach is just a general best practice for performance optimization-it’s not specifically for painting with the largest content.
For a more comprehensive picture, please check out the detailed guide to image optimization on our website.
Preload maximum content drawing
If your LCP element is an image, another strategy to improve LCP is to preload the largest content-rich paint image. This is why you may see suggestions such as “preload the drawing image of the largest content” in PageSpeed Insights.
By preloading, you can tell the user’s browser to download certain resources first, such as as specific images of your site’s LCP elements.
The most non-technical way to preload LCP images is to use plug-ins such as Perfmatters, which provides a specialized preload key image function. All you need to do is specify how many images to preload-we recommend starting with only one, because preloading too many assets can have a negative impact.
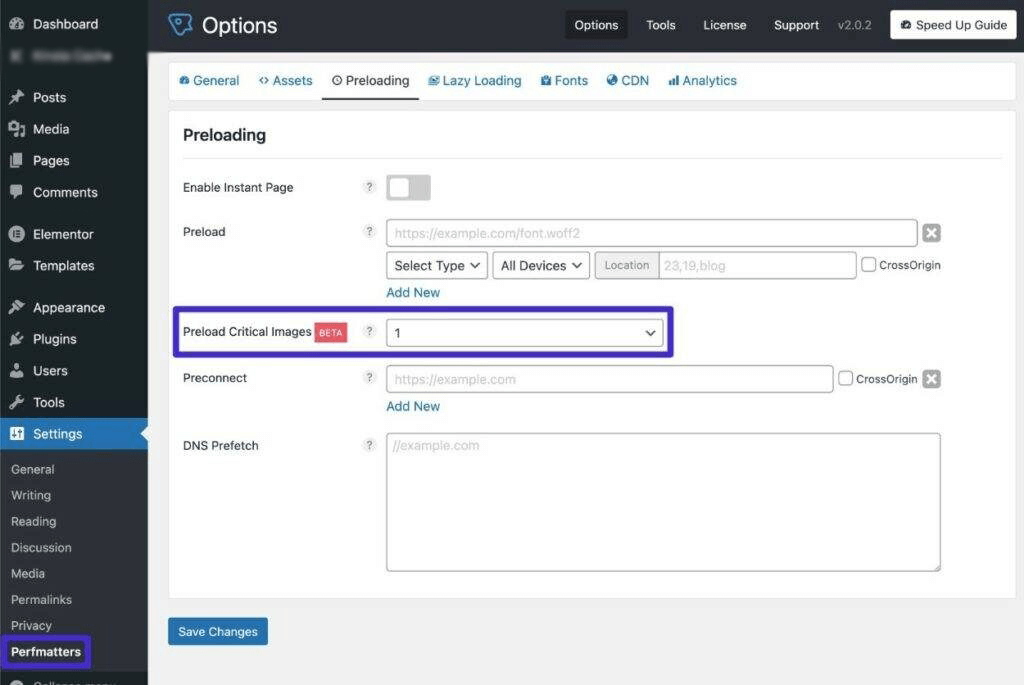
How to preload LCP Images with Perfmatters
There are also some free plug-ins to do this in WordPress.org, such as WPZOOM’s preloaded feature image plug-in, and other advanced plug-ins, such as FlyingPress.
Check for lazy loading problems
Another problem that can trigger the “preload maximum Contentful Paint image” message in PageSpeed Insights is how lazily your WordPress site loads images.
Alternatively, this can trigger the “maximum content drawing image lazily loaded” warning in PageSpeed Insights.
Lazy loading allows you to speed up the initial loading time of your site by waiting for certain resources (such as images) to load until users begin to interact with your site.
While this is usually a good thing, if your site tries to lazily load images as your LCP elements, it may slow down your LCP time. For this reason, you need to make sure that your site does not lazily load any images that are visible in the initial viewport.
If you use the lazy loading feature of local browsers introduced by WordPress in version 5.5, you should not encounter this problem, as WordPress has automatically excluded the first content image in version 5.9 of WordPress.
If you want to exclude more images than the first image, you can use the wp_omit_loading_attr_threshold function (but most people don’t need to do anything here).
However, if you are using a lazy loading plug-in driven by JavaScript, you may need to set this exclusion manually in the plug-in settings. For example, the Perfmatters plugin includes an option that allows you to exclude the first “X” image from lazy loading.
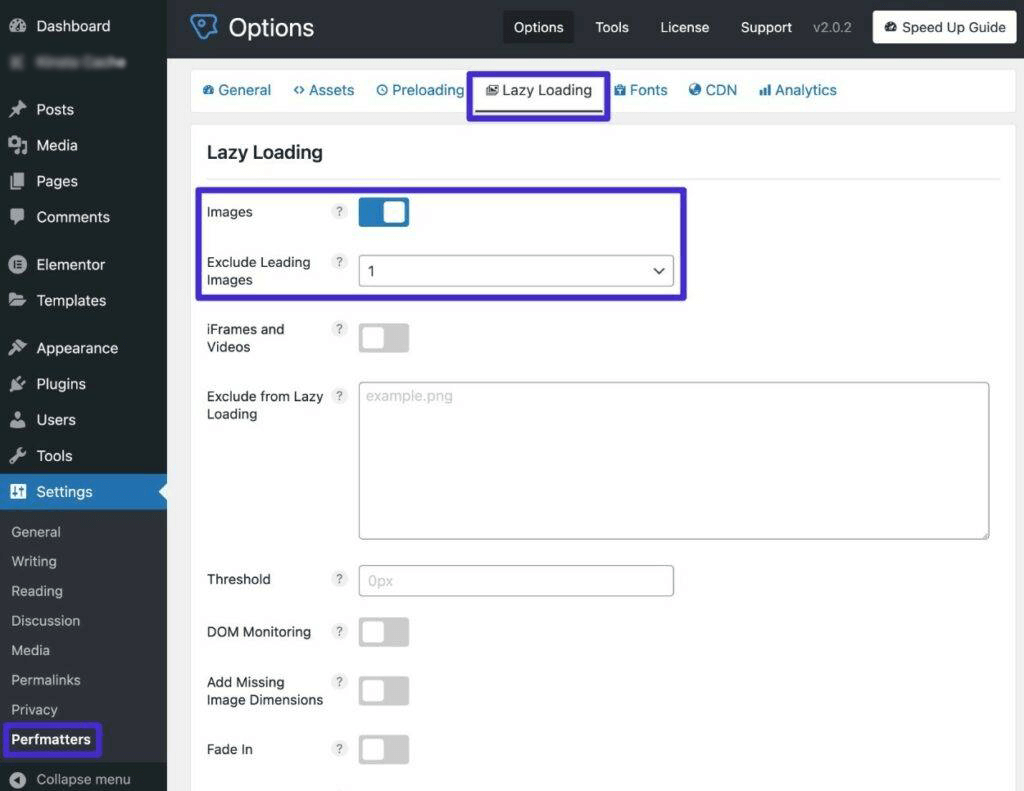
How to exclude leading pictures from lazy loading in Perfmatters
If your lazy add-on plugin does not allow you to set this type of exclusion, you can switch to a different plugin that it can.
Optimize font loading using Font-Display: Optional
If your LCP element is text, the font loading process of your site may delay the appearance of the text, which will slow down your LCP time.
Typically, this happens when using custom fonts. If your site is configured to wait for any text to be rendered until the custom font is loaded, this will slow down if the custom font file takes a long time to load.
To solve this problem, you can use Font-Display: Optional CSS descriptor.
This tells the browser to use a backup font if the custom font is not loaded in a small window (usually within 100 milliseconds or less).
In popular terms, this basically means that browsers should give custom fonts a chance to load. However, if the loading speed of the custom font is not fast enough, the browser should use a backup system font to avoid further delay in the content.
Alternatively, you can use Font-Display: Swap, which can load backup fonts immediately and then “swap” custom fonts after loading them. However, if the font size is different, this method may cause the problem of cumulative layout offset, so you should be careful.
Unless your custom font is absolutely necessary for your website design, using Font-Display.Optional is usually the best choice. From a Core Web Vitals point of view, option is usually the best choice.
If you prefer to use CSS directly, you can manually edit the Font-Display property in the stylesheet of your subtheme.
If you don’t want to use CSS, you can also find plug-ins to help you do so, although most of them focus on optimizing Google fonts.
- Asset CleanUp-supports free Google fonts and professional custom local fonts.
- Perfmatters-provides functionality for Google fonts.
If you use Elementor to design your website, Elementor also includes a built-in option that allows you to use this for pages created in Elementor.
- Enter Elementor → Settings.
- Open the Advanced tab.
- Select the Google Fonts Load drop-down menu as Optional.
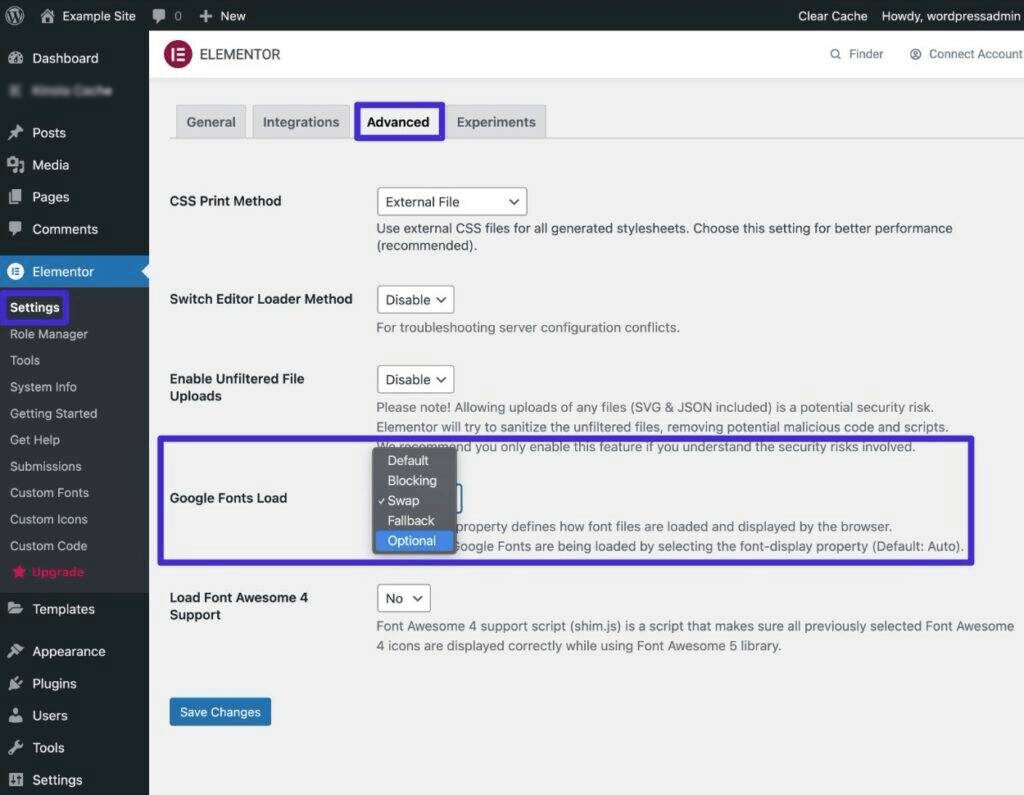
How to set Font-Display: Optional in Elementor
In general, if you are improving the performance of your site in any way, all of these optimizations are standard recommendations. If you take the time to optimize your site, your LCP score should drop accordingly, and your users will be happy about it.
Frequently asked questions about maximum content rendering (LCP)
Understanding concepts like LCP is less intuitive than understanding the overall load time of a single page. With that in mind, here are some of the most common questions we’ve seen about LCP scores.
How does LCP affect the performance of my website?
When measuring the performance of your site, a single overall load time does not give you an accurate understanding of the degree of optimization of your page. Focusing on specific metrics such as LCP can give you a better understanding of how the server responds. It also tells you how long it will take for users to view your site in full. Targeting LCP or other metrics will only improve the overall performance of your site because they are part of a larger whole.
Is LCP the same as the page load time?
Site owners usually test their pages and see when each page is loaded. Some performance measurement tools give you a single number, nothing else. However, individual metrics such as LCP can help you better understand what actually happens when users visit your site.
LCP is likely to occur before the entire page is loaded. And some elements may be populated after it (larger file size or image). Ideally, your LCP time will be faster than your overall page load time.
Besides LCP, what other web core indicators are there?
When Google tries to determine whether a website can provide a strong user experience (UX), its Core Web Vitals is the yardstick.
LCP is just one of them. Others include first input delay (FID) and cumulative layout offset (CLS). You can also check First Contentful Paint (FCP), which is more relevant to the user’s perception of the page’s loading speed.
Summary
When evaluating the performance of your site, it is best not to focus on individual numbers, such as the time it takes to load the home page. While this is important, individual metrics such as LCP can help you identify specific elements and areas that may need to be improved.
The maximum content drawing for each page lets you know how long visitors must wait until the page is loaded enough for them to understand it. Using FCP, which is the time it takes to view the page. Even so, they may have to wait longer until it becomes interactive, which may occur after LCP. This indicator is a difficult problem. However, by optimizing this score, you can provide a better user experience on your site.

