
Today we want to explore in depth how to better use and understand the data of the popular website speed testing tool Pingdom. You can use it to do what we call a waterfall analysis of your WordPress website. This can help you diagnose performance problems quickly without misdiagnosing them.
many times we see WordPress users explain data errors in the Pingdom speed test tool, which sometimes leads to the site being configured in a worse state than before. Keep in mind that all such tools will be used as guides and they will never be 100% accurate. It is important to be consistent in all tests and use the same tools.
hidden
Pingdom
so popular? Well, first of all, it’s probably the easiest speed test tool to use! Not everyone is a network performance expert, so other alternatives can be overwhelming for a typical WordPress user. Sometimes, as they say, less is more. After all, you only care about two things: how fast your site is and how to make it faster.
Pingdom website Speed Test

Pingdom currently allows you to test the speed of any website from 7 different locations (5 continents) around the world:
Asia-Japan-Tokyo
- Europe-Germany-Frankfurt
- Europe-UK-London
- North America-USA-Washington D.C.
- North America-USA-San Francisco # % Pacific-Australia-Sydney
- South America-Brazil-S ã o Paulo
- Note: we note that sometimes not all test sites are available. This is probably because it was down for maintenance, or because too many people tried to test it and overloaded it. If the test site location you have been using no longer exists, please come back in an hour or two to check. There’s a good chance it’ll show up again.
- the test location you choose is actually very important because it is related to the physical location where your site is actually hosted. This is where a little thing called network delay comes into play. But we will cover this in more detail below.
uses Pingdom speed testing tools for waterfall analysis.
web pages are made up of different resources, such as HTML, JavaScript, CSS, images, and video. Each of these generates a request to present what you see on the site. In general, the more requests you make, the slower your site will load. This is not always the case, but in most cases it is. Below
we will break down each Pingdom section and explain the meaning of the information in more detail, as it is related to the overall performance of your site and how to do waterfall analysis.
Pingdom summary
performance insight into
- response code content size by content type and request
- by domain content size and request
- waterfall
- case study domain configuration
- Pingdom Feed
- when you run a WordPress site through Pingdom, it generates a performance rating, total load time, total page size, and the number of requests you have on the site. In our example, we are using perfmatters.io, an e-commerce site that runs Easy Digital Downloads.
- as you can see, we ran the first test with a score of 88pm on Pingdom and a total load time of 541ms. It lets us know the total size of the merged assets and the number of requests.
DNS and the Pingdom speed test before caching
and then we ran an additional test, and now our total load time is 392ms, the same page size and number of requests! What was that all about? ? if you run your website multiple times through the Pingdom speed test tool, you may notice this. Larger sites will notice greater differences. There are three main reasons for
: DNS cache, CDN cache and WordPress cache. This is why you should always run tests multiple times. Of course, external calls to third-party resources and API can also have an impact. Learn more about the reason in our waterfall analysis. Pingdom Speed Test after

DNS does
want to get a better Pingdom score on your WordPress website? Depending on your site and configuration, you may not always get the perfect 100max 100, especially for those running e-commerce sites and marketing pixels. But simply taking some time to improve your score is a good place to start. The overall speed is really important.
Sometimes, the user experience may also outperform some of the network performance skills you read on the web. You can’t forget the user experience! But please rest assured that we will share some further tips and tips with you below to understand how we have brought the above website to its current location, so please continue to read.

Improve page performance
performance insight section, now “improve page performance” has been updated in 2018, they have removed some old projects and added new ones. This is probably because some of the recommendations they reported are no longer as relevant as they used to be. When it comes to Web performance optimization, things change all the time. Sometimes it can be troublesome if people just want to pursue the perfect Pingdom score.
Pingdom’s performance insight into
however, we will keep the whole section (some old and new) in our posts, because it is important to understand how these scores are calculated. These are basically based on Google PageSpeed Insight rules. In general, if you improve these on the site, you should see a reduction in overall load time.
here are some categories of page performance improvements:
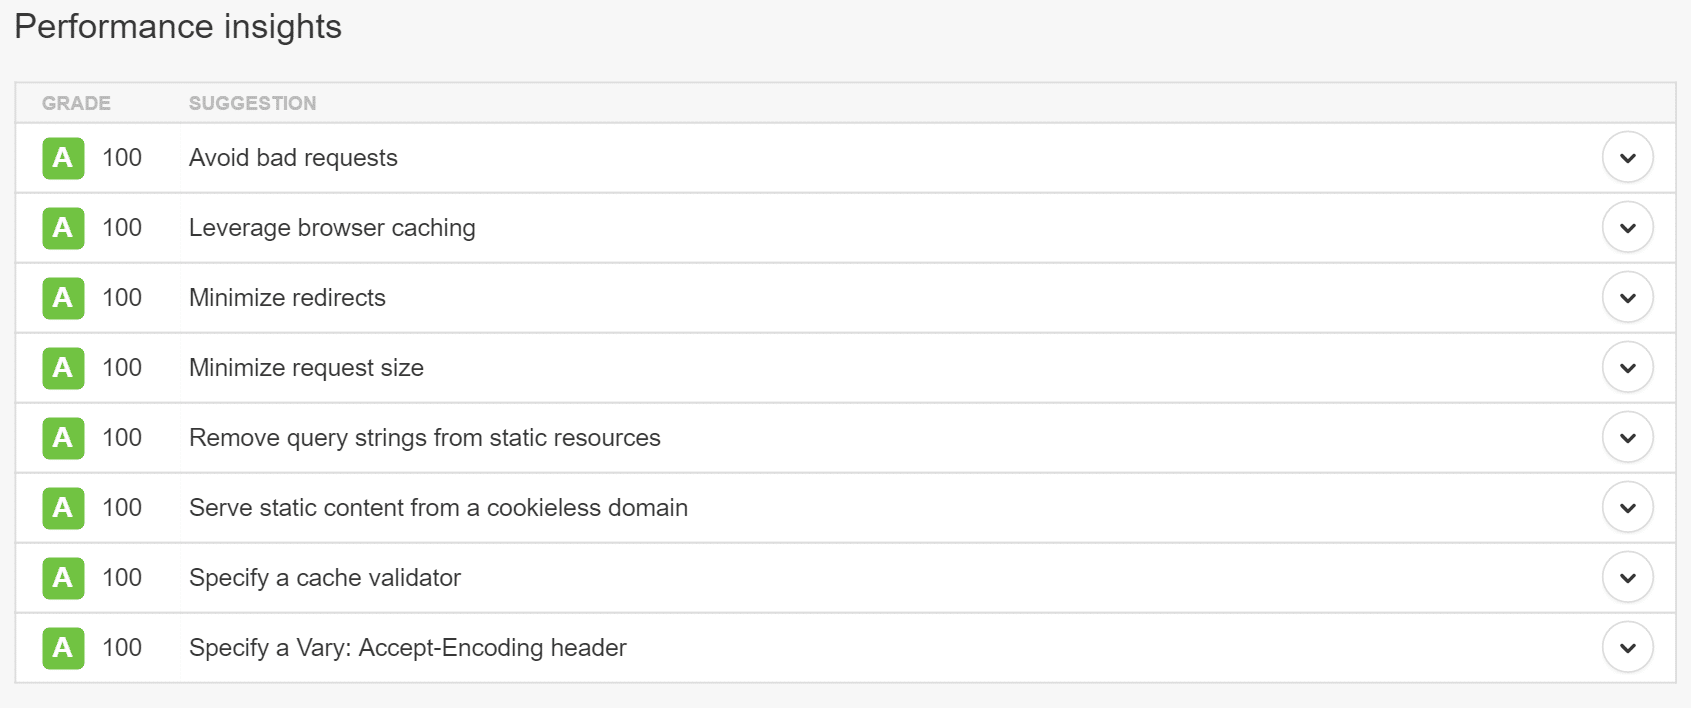
uses content delivery Network (CDN)
to avoid HTTP 404 (not found) error
minimizes redirect
- adds expired headers
- removes query strings from static resources
- uses Cookie-free domain
- parallel downloads
- specified cache validator
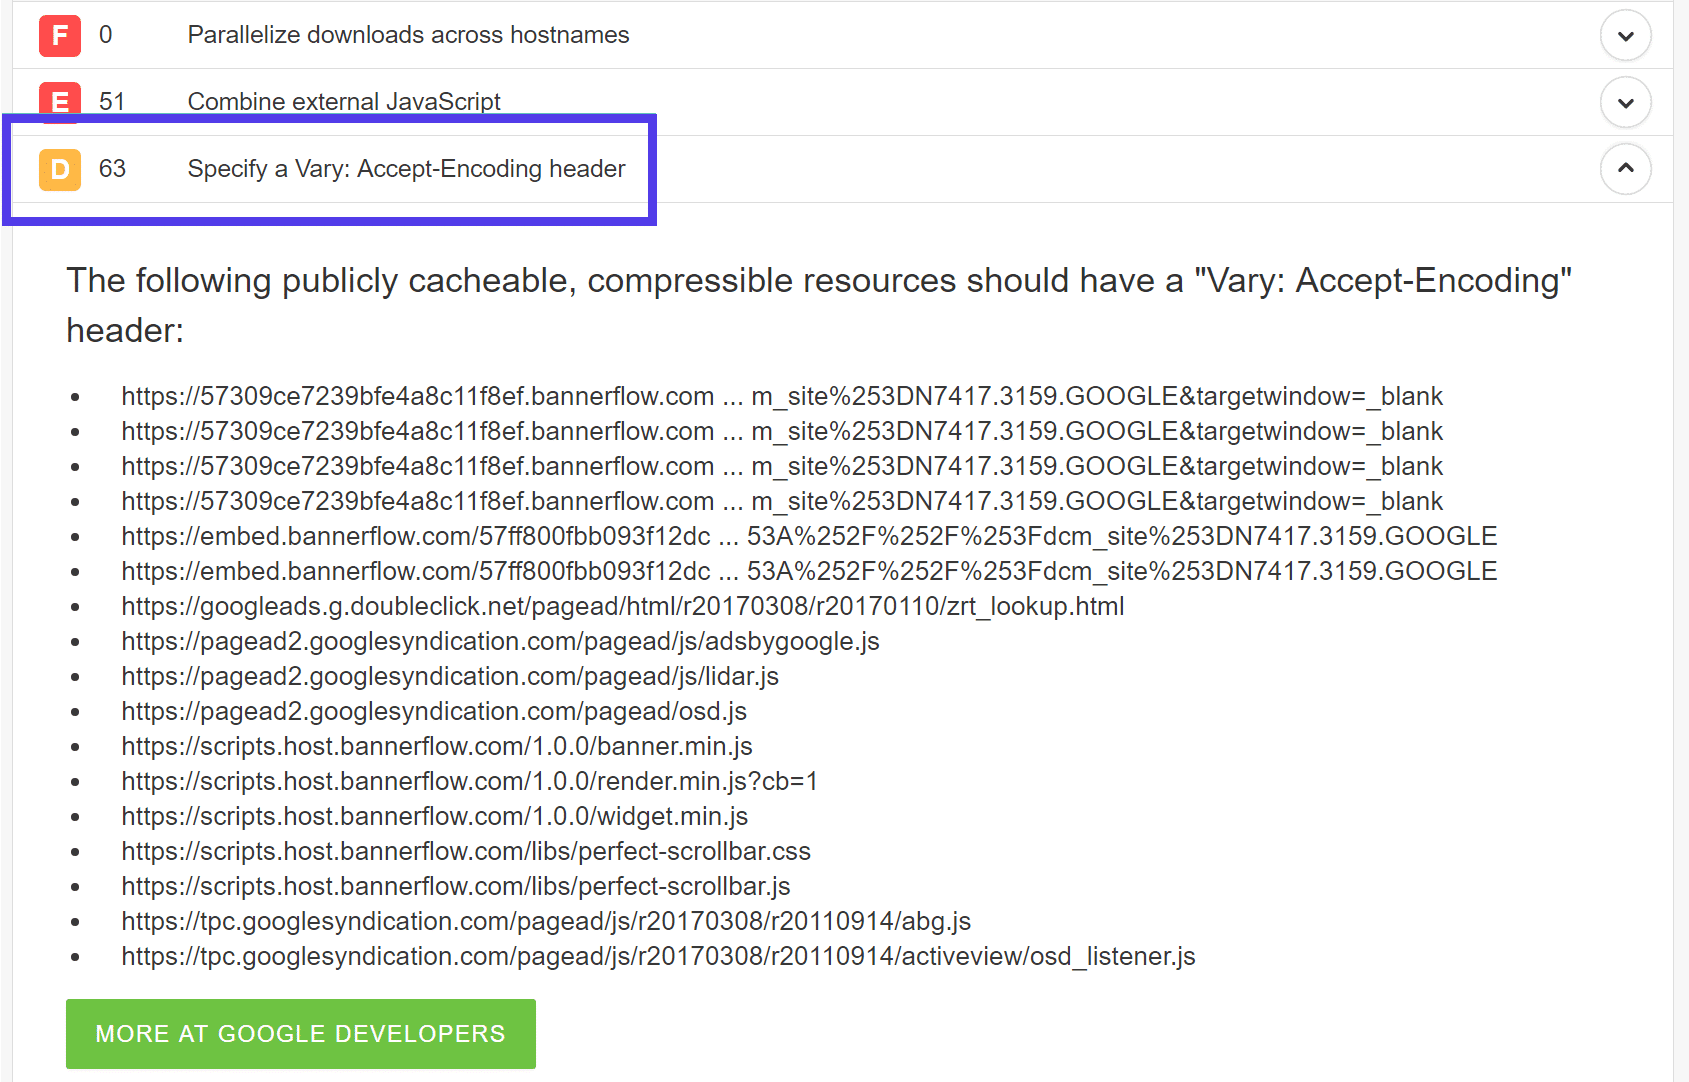
- specifies a Vary: Accept-Encoding header
- now Let’s take a closer look at some of them. See what still applies today.
- uses content delivery Network (CDN)
- one of the most important services implemented on your WordPress website today is the content delivery Network (CDN). These are networks of servers around the world (also known as POP). They are designed to host and deliver copies of static (and sometimes dynamic) content of WordPress sites, such as images, CSS, JavaScript, and video streams. Some of the benefits of
CDN include improved performance (lower TTFB and network latency), lower bandwidth and hosting costs, and even SEO advantages.
important tip: the newly updated Pingdom tool currently has an error that can accurately detect any CDN provider.
uses content delivery Network (CDN)
some of our recommended third-party CDN providers include:
Also shoot Cloud (currently in use CDN service provider)

Aliyun
Huawei Cloud
- KeyCDN
- Cloudflare
- StackPath
- CDN77
- in our own CDN speed test, we found that CDN can reduce page loading time by more than 50% in some cases!
- avoids HTTP 404 (not found) errors
- this section was formerly known as “avoid error requests.” It’s always relevant! This warning, as it sounds, is a request that cannot be completed successfully. This usually happens when you manually link to assets or images that have been deleted, resulting in a 404 error. This appears as an orange circle in Pingdom and 404 of the response header status.
avoid error requests-
always ensures that every request on your site returns in a successful state. This ensures that no queries are generated for assets that no longer exist.
minimizes redirecting

too many redirects are always something you need to pay attention to. Simple redirects, such as a single 301redirect, HTTP to HTTPS, or www to non-www (and vice versa) are fine. Many times, some areas of your site need these. However, each will have an impact on the performance of your site. If you start to stack redirects together, it is important to understand how they affect the performance of your site. This applies to page and post redirection, image redirection, and so on. The
redirection is displayed as a blue circle in the Pingdom and 301 or 302 on the status of the response header. How much impact does
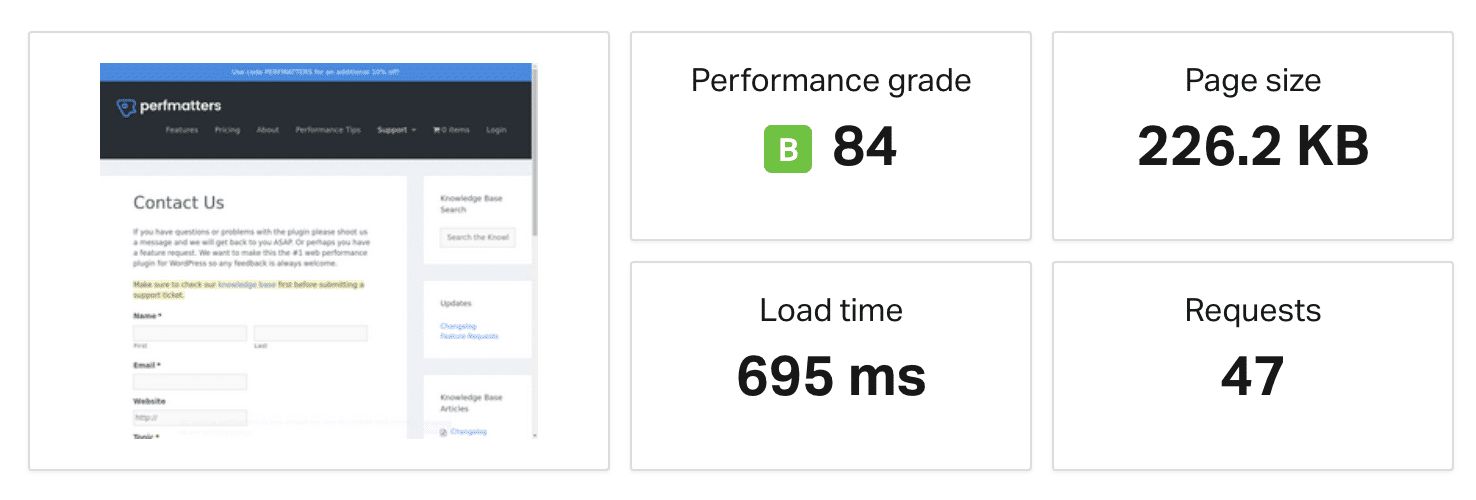
redirection have on your website? Let’s do a little test. First, we run the speed test on the contact us page:
. As you can see below, our total load time is 417 milliseconds.
did not redirect the site speed test
and then we modified URL slightly and ran another speed test to see the impact of multiple redirects.https://perfmatters.io?ref=1172/contact/. As you can see, it now takes 695 milliseconds to load the same page. That’s an increase of 66%.

has multiple redirected site speed tests
to see our in-depth articles on WordPress redirection, as well as best practices for improving performance. The recommendation forhttp://www.perfmatters.io/contactto add out-of-date headers
was formerly known as leveraging browser caching. In layman’s terms, every script on a WordPress site needs to be appended to a HTTP cache header (or should be). This determines when the cache on the file expires. To resolve this issue, make sure that your WordPress host has the correct
header and
header settings. Review the steps on how to manually add cache headers to your server, and read the guide on how to add expired headers. Another problem with
leveraging browser caching-caching headerscache-controlis that when you load third-party scripts, you do not have the right to add cache headers because you cannot control their Web server. Common culprits include Google Analytics scripts and marketing pixels such as Facebook and Twitter. To solve this problem, you can use a plug-in such as Perfmatters to host your Google Analytics script locally (although this is not officially supported). WP Rocket can now also choose to host your Facebook marketing pixels locally.expiresmoving scripts locally may vary depending on the extent to which it affects site performance. One advantage is that you have complete control over the files and can provide services from your own CDN. This also removes another third-party DNS request. However, it is also important to remember that these files may have been cached in people’s browsers.
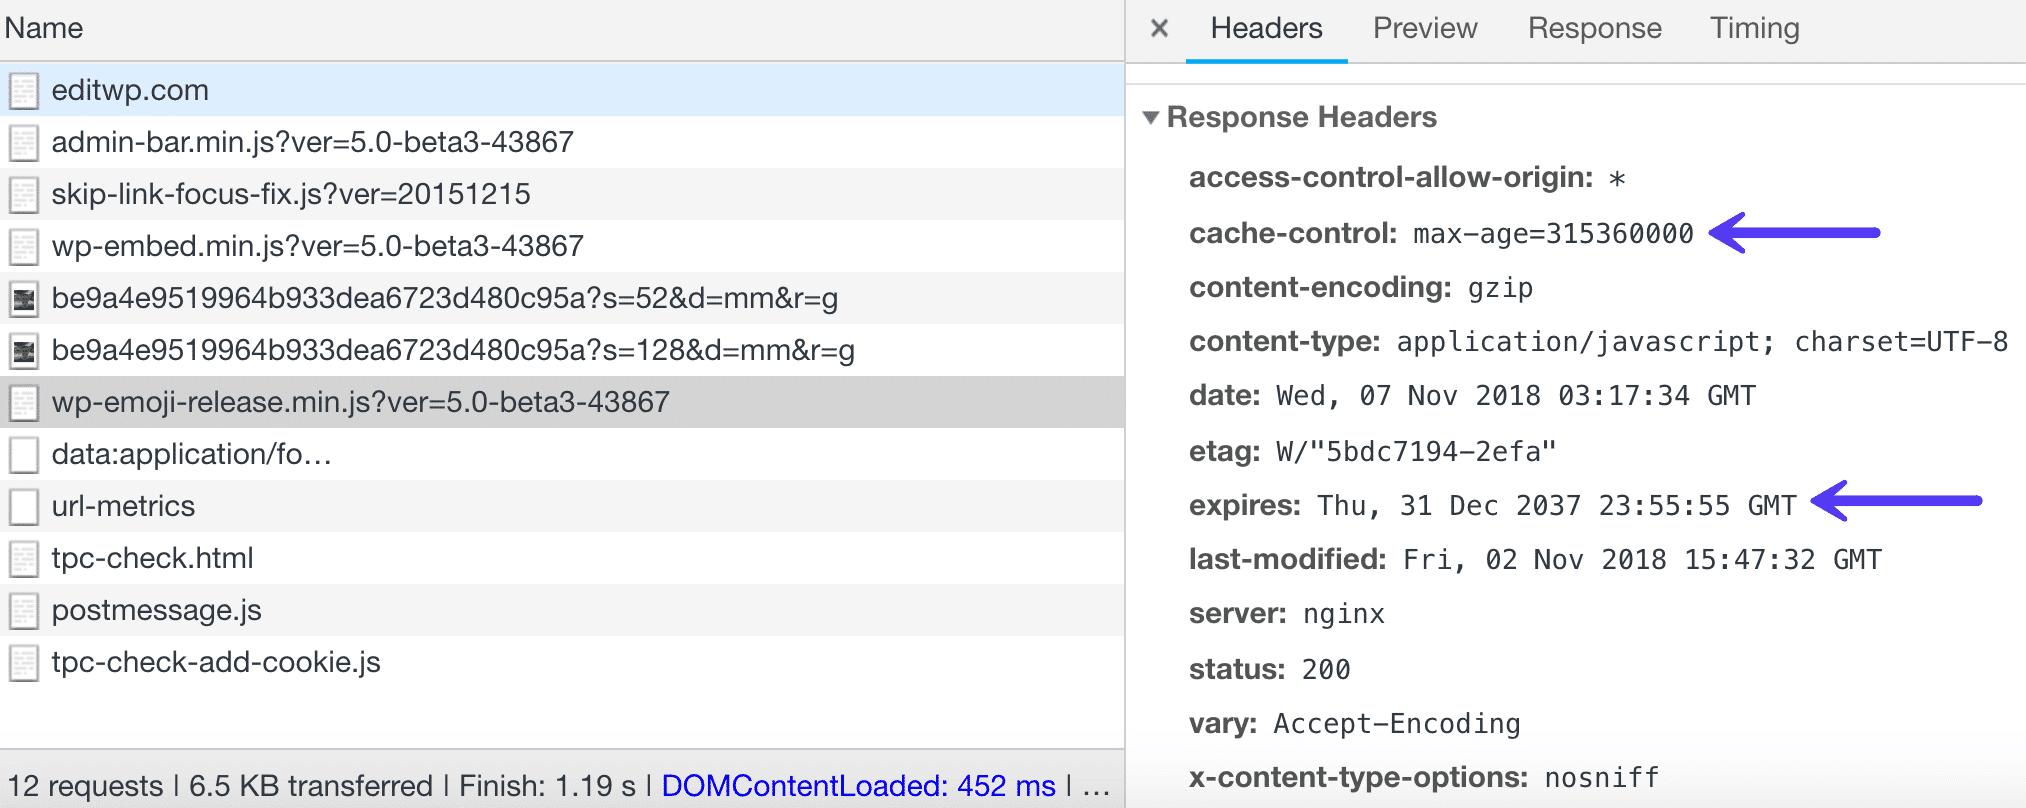
See our in-depth article on how to fix browser cache warnings. Another common problem with
deleting query strings from static resources
is processing query strings. Your CSS and JavaScript files usually have file versions at the end of their URL, such as
. Some servers and proxy servers cannot cache query strings. Therefore, by removing them, you can sometimes improve the cache.
you can use an advanced plug-in like Perfmatters, which has a simple one-click option to delete the query string.
or you can manually add the following code to your themehttps://domain.com/file.min.css?ver=4.5.3file. A better option is to use a free plug-in like Code Snippets to add code. So you don’t have to edit your theme directly.
, however, before you immediately delete the query string on the site, it is important to understand why the query string is used. WordPress developers often use file versioning to solve caching problems.
, for example, if they launch updates and changes tofunctions.php, from
function remove_query_strings() {
   if(!is_admin()) {
       add_filter('script_loader_src', 'remove_query_strings_split', 15);
       add_filter('style_loader_src', 'remove_query_strings_split', 15);
   }
}

function remove_query_strings_split($src){
   $output = preg_split("/(&ver , ?ver)/", $src);
   return $output[0];
}
add_action('init', 'remove_query_strings');
to
, it will be considered a completely new URL and will not be cached. If you delete the query string and update the plug-in, this may cause the cached version to continue to provide services. In some cases, this may damage the appearance of your site until the cache resource expires or the cache is completely refreshed.style.cssin addition, some CDN can cache query strings.?ver=4.6removes query strings from static resource warnings?ver=4.7see our in-depth tutorial on how to remove query strings from static resources.
uses Cookie-free domain
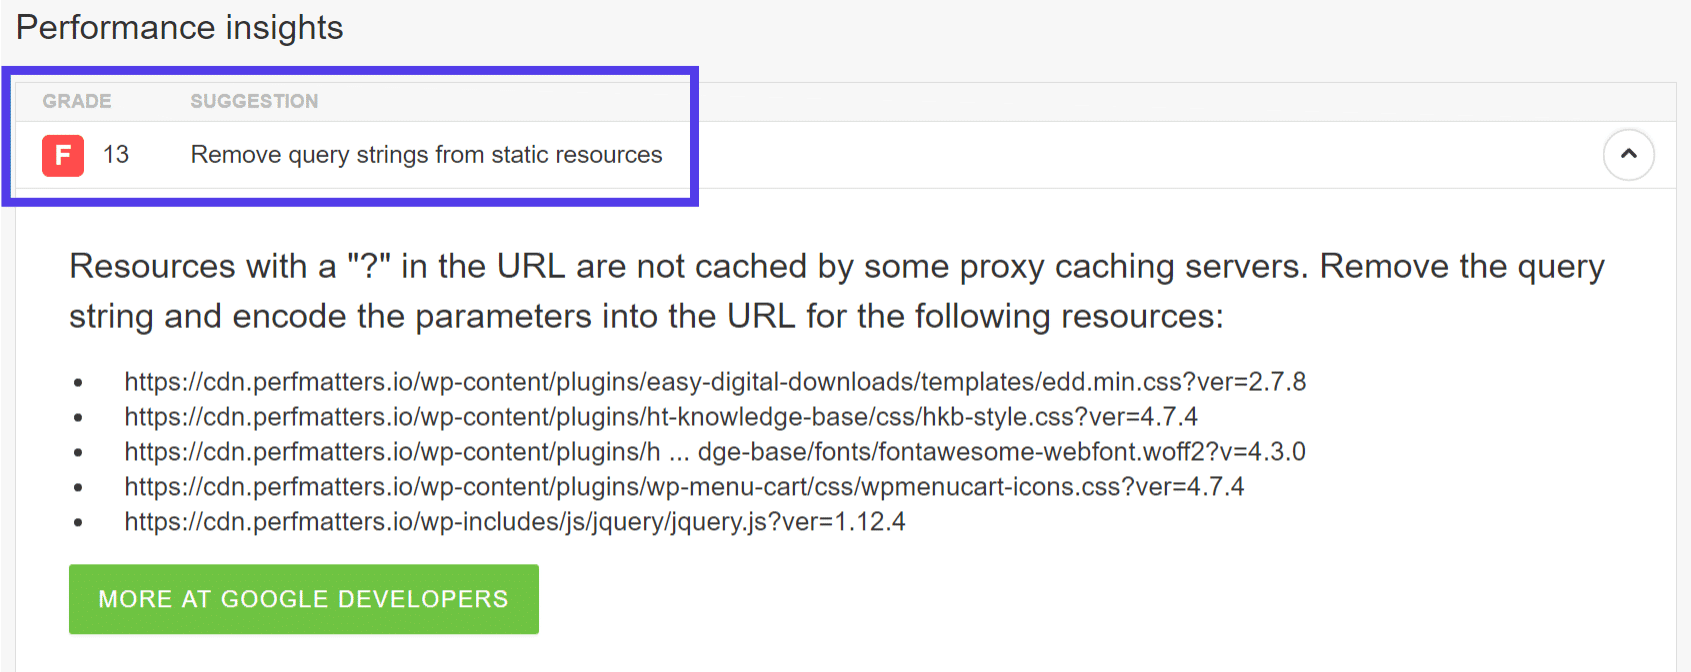
We have an in-depth article on how to handle static content from services without cookie domain warnings. Many times you can ignore this warning because new protocols such as HTTP/2 now make it less important. The cost of a new connection is usually higher than the cost of streaming all content over the same connection. However, two ways to solve this problem are to use the CDN provider to remove the cookie or to create separate domains and / or subdomains.
provides static content from no cookie domain warnings
uses GZIP Compression component
when Pingdom detects assets that are not compressed with GZIP, a “use GZIP Compression component” warning appears. GZIP is a compression method that reduces the size of text-based files, such as HTML documents and CSS/JS files. Enable GZIP compression on the server and compress web pages and assets before sending them to visitors. From our tests, we saw that enabling GZIP compression reduced the requested file size by more than 78%.

uses the GZIP compression component
part of the server provider, so you don’t have to worry about enabling GZIP manually because it is enabled by default on the server. If you find that your virtual host does not have GZIP enabled, we recommend that you contact their support team to enable it immediately, as it can have a huge impact on your page speed. If you still see “use GZIP Compression components” after enabling GZIP on the server, it is possible that the server hosting the external assets required by the site is not GZIP enabled. If this is the case, there is nothing you can do to change the server behavior. The result of the
parallel download across hostname

“parallel downloads across hostnames” warning is due to the limitations of HTTP/1.1 and the limit on the number of concurrent connections they can establish with the host by Web browsers; this is usually six connections. This warning usually appears on websites with a large number of requests. In the past, the only way to get around this limitation was to implement what they called domain fragmentation. However, if you are using a network host or CDN provider that supports HTTP/2, you can now safely ignore this because you can now load multiple resources in parallel over a single connection.
parallel download across hostname warning
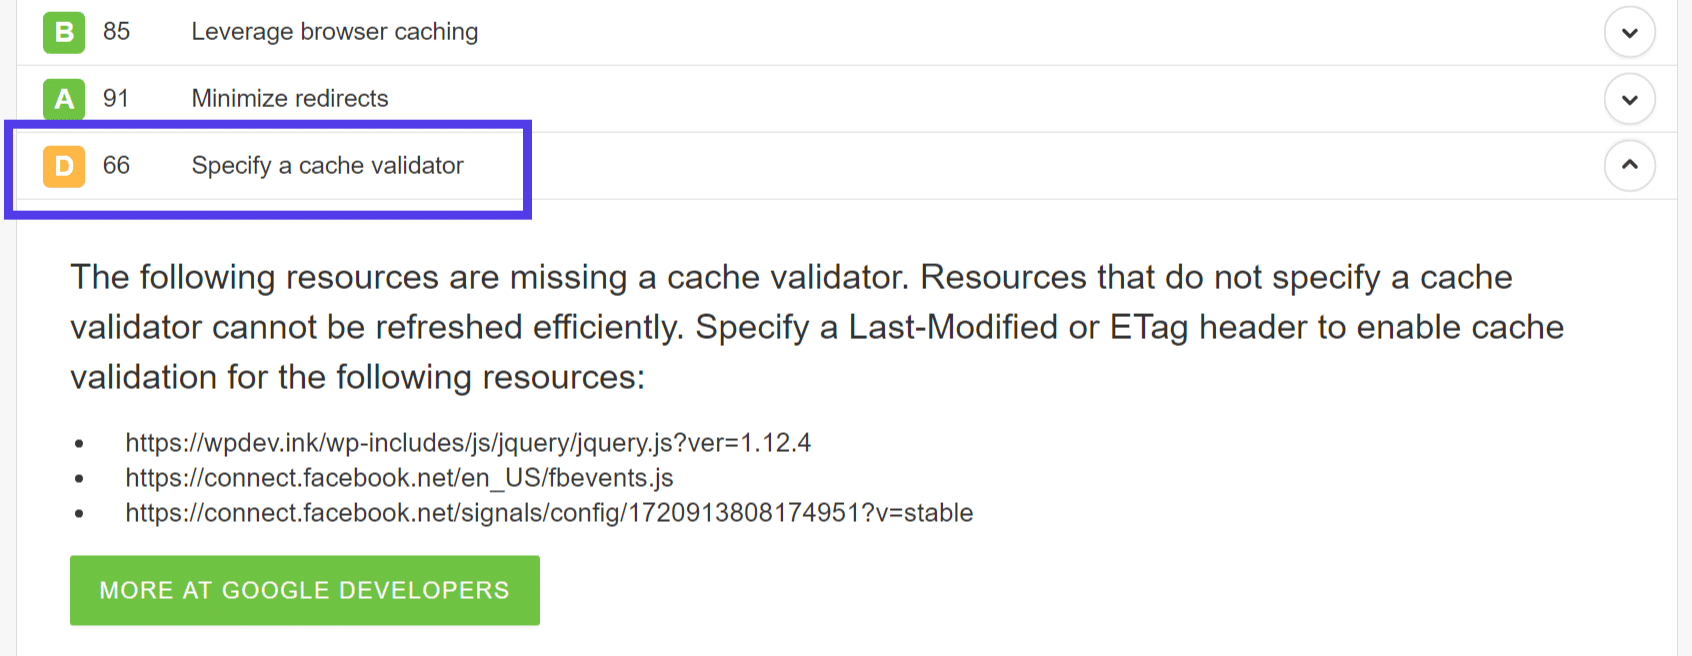
specifies cache validator
this warning refers to the lack of HTTP cache headers, which should be included in each source server response because they all validate and set the cache length. If the header is not found, it generates a new request for the resource each time, which increases the load on the server. These header files include

, and
. Just like browser cache warnings, these headers should be added automatically by your WordPress host. If you have a third-party request, you will see that there is nothing you can do because you cannot control their Web server.
specify cache validator warninglast-modifiedread our in-depth article on how to fix the specified cache validator warning.ETagspecifies a Vary: Accept-Encoding headerCache-ControlWe have an article on how to fix specified variables: accept encoding header warnings. This is a HTTP header that should be included in each source server response because it tells the browser client whether it can handle a compressed version of the content.Expiresspecifies a change: accept wharf warning
Pingdom response code the next part of the
Pingdom speed test tool is the response code. The response code, also known as the HTTP status code, is like a short comment from the Web server, which is added to the top of the page. This is a message from the Web server to let you know what happens when you receive a request to view the page. Some common ones are:
200: “everything is fine.” This is the code delivered when the web page or resource runs exactly as expected.
Pingdom 200 response Code sample
301: “the requested resource has been permanently moved.” This code is passed when a web page or resource has been permanently replaced by another resource. It is used for permanent URL redirection.
Pingdom 301 response Code sample
404: “requested resource not found.” The most common error message. This code means that the requested resource does not exist and the server does not know if it ever existed.
- Pingdom 404 response code sample
 Content size by content type and request
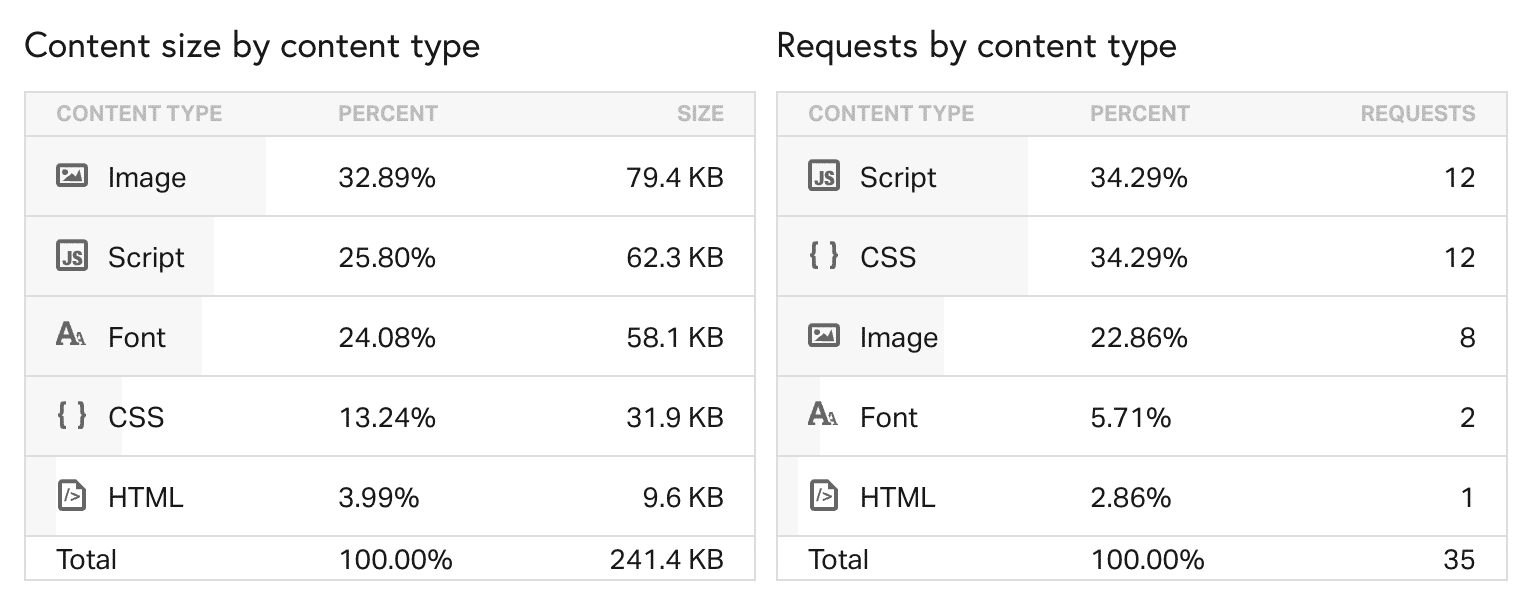
 - the next part is the content size by content type and the request by content type. Each of these helps you quickly view the most resource-intensive content on a web page. According to HTTP Archive, images typically account for 43% of the average total size of a web page. We also see that this is usually the case. However, as you can see at the bottom of this site, this is not always the case.
 Pingdom content type
 - to optimize your images, we strongly recommend that you read our in-depth article on how to optimize Web images and WebP. There are many great tools and plug-ins that can further compress your images and make sure they are not the main content loaded on your site’s pages. In our example above, the perfmatters.io website is using great big font icons instead of images. This could be a great strategy that can have a huge impact.
 Content size by domain and request
content size and request by domain is a good way to quickly see which external services and scripts are on the site. In our example, you can see that we loaded all the assets from CDN. The initial HTML DOC of the Web site is then loaded from the Web server, as well as external calls to the Google Analytics domain. Depending on your site, you may have more external services, such as Facebook, Twitter, Hotjar, SumoMe, AdRoll, New Relic, CrazyEgg, etc.
Pingdom requests by domain
generally, the less external requests you can make, the better, because each external service introduces its own latency, TLS handshake latency, DNS lookup, and so on. In general,
is best to minimize the number of requests and host assets in one place, such as moving them to your Web server or CDN. One example is that the font is really good. Instead of linking to an external script to get a great font, download it and provide it directly.
Pingdom Falls Diagram
Last but not least, we have the Pingdom Speed Test tool request section, which generates a waterfall diagram of all individual requests on your web page (shown below). You can then analyze each request to see the causes of site latency and performance problems. That’s what we mean when we say we’re doing waterfall analysis. The following is a more in-depth summary and / or definition of the color meaning of each state.

Pingdom Falls Analysis
DNS (Pink)
so what is DNS? Well, think of it as a phone book. There are servers called domain name servers that hold information about your site and which IP it should be routed to. When you first run your Web site through Pingdom, it performs a new lookup and must query the DNS record for IP information. This will result in some extra search time. The location of the DNS server is also important. DNS Latency
in
Pingdom when you run your Web site multiple times through Pingdom, it caches DNS because it already knows the IP information and does not have to perform a lookup again. This is one of the reasons why your website displays faster after running through Pingdom many times.
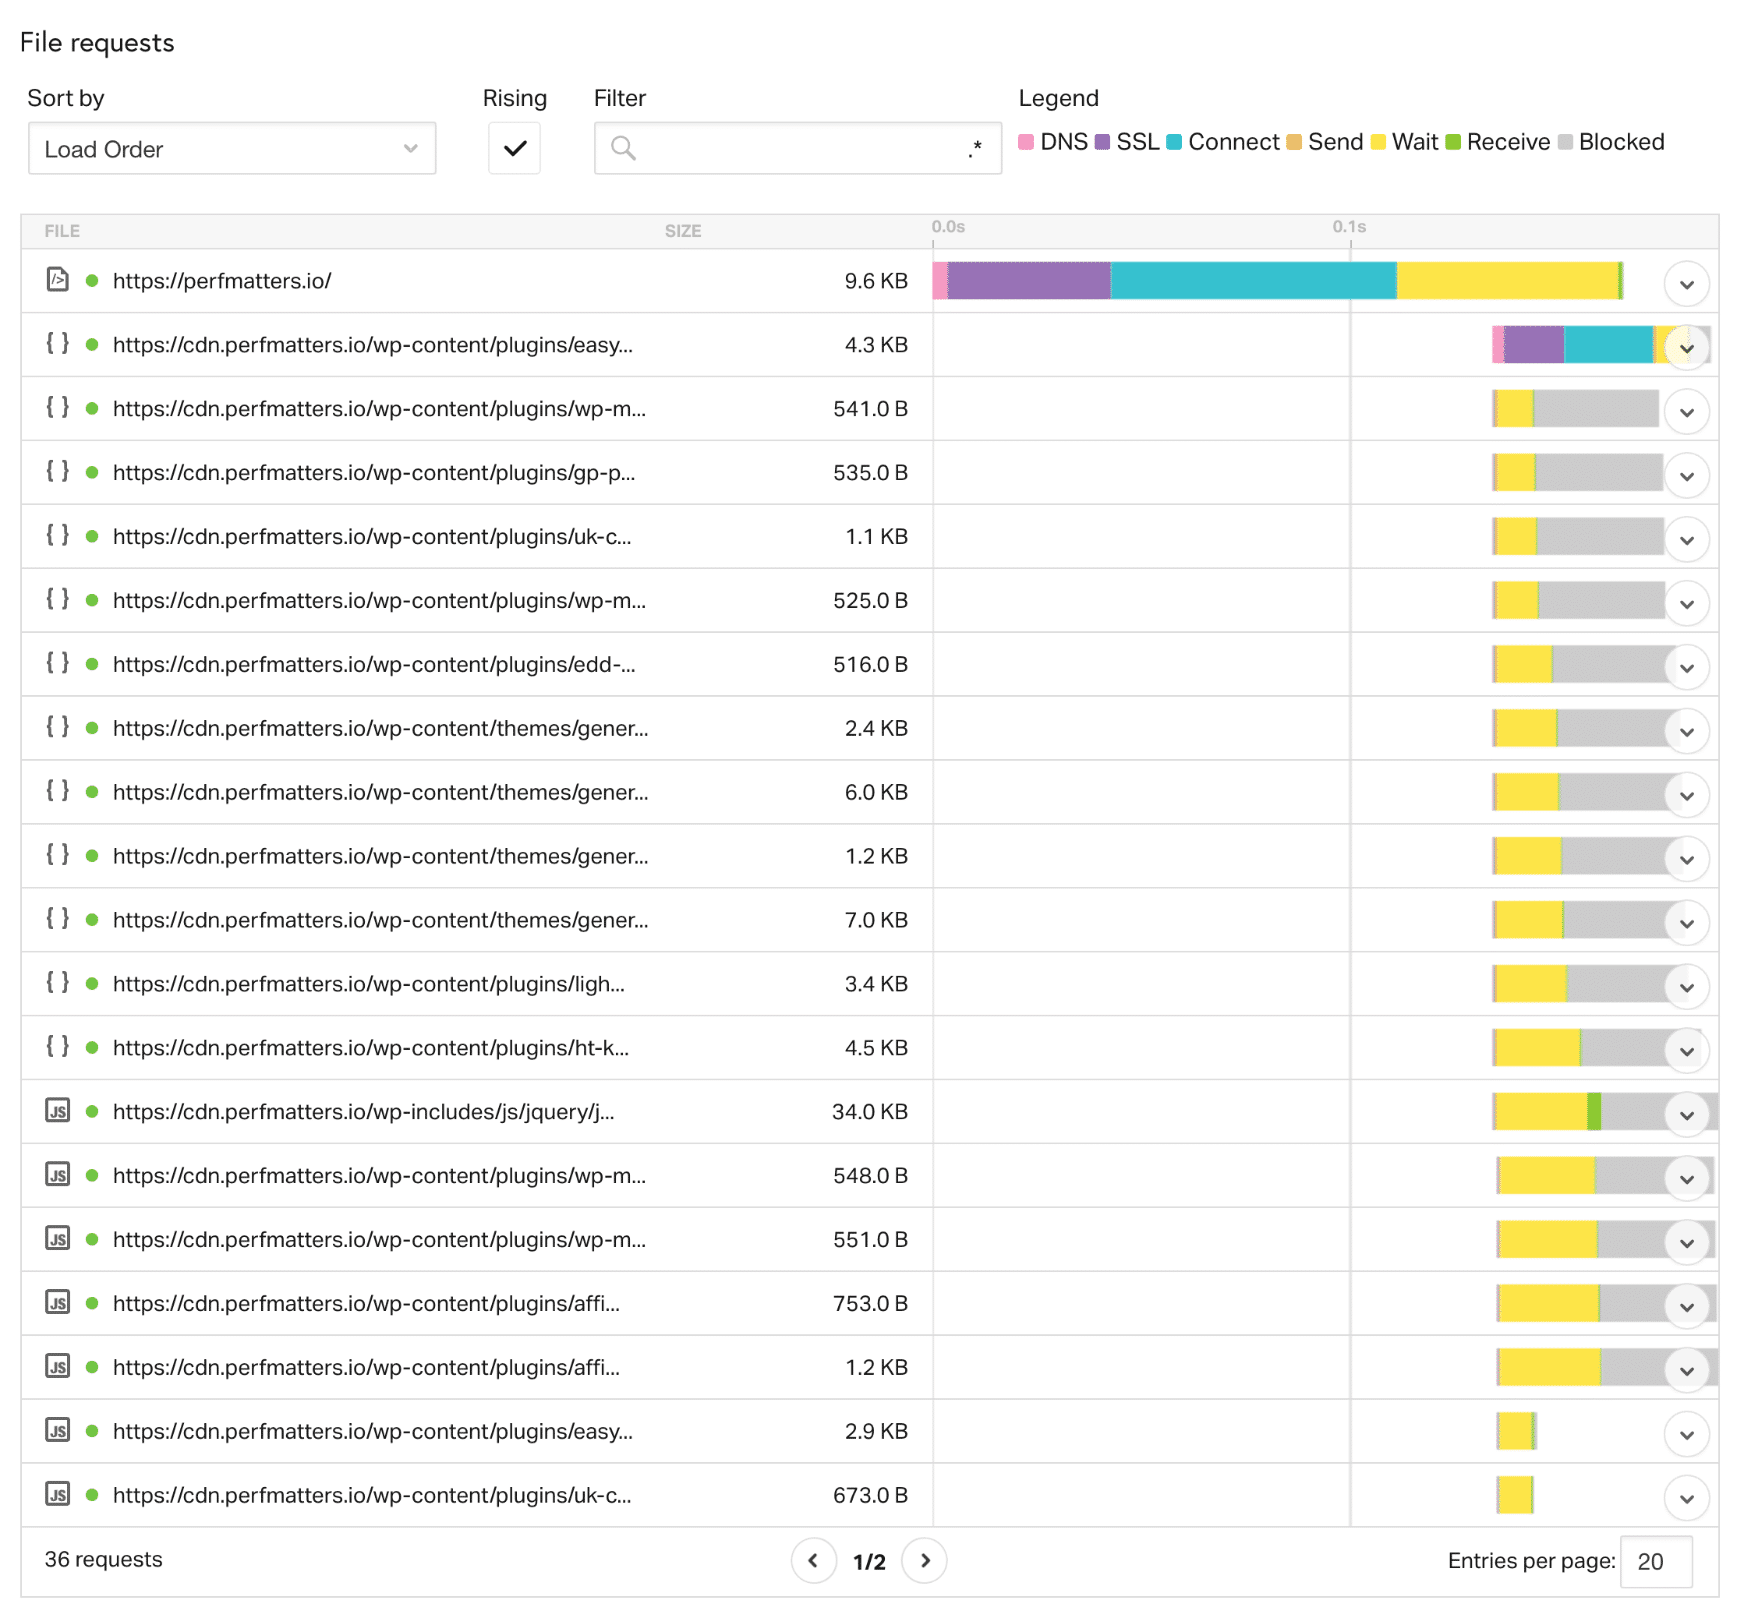
as you can see on the following screen, in the second test we ran, the DNS lookup time for the initial DOC load was 3.6ms. Usually it drops to 0 milliseconds, in fact, it should, because the request is already cached. This is an area that many people misunderstand! Caching DNS
in
Pingdom in addition, you can further optimize it by using advanced DNS services, and it has many additional benefits. Cloudflare’s free DNS is also fast (for overseas users)! There are other reasons why your site may display faster after
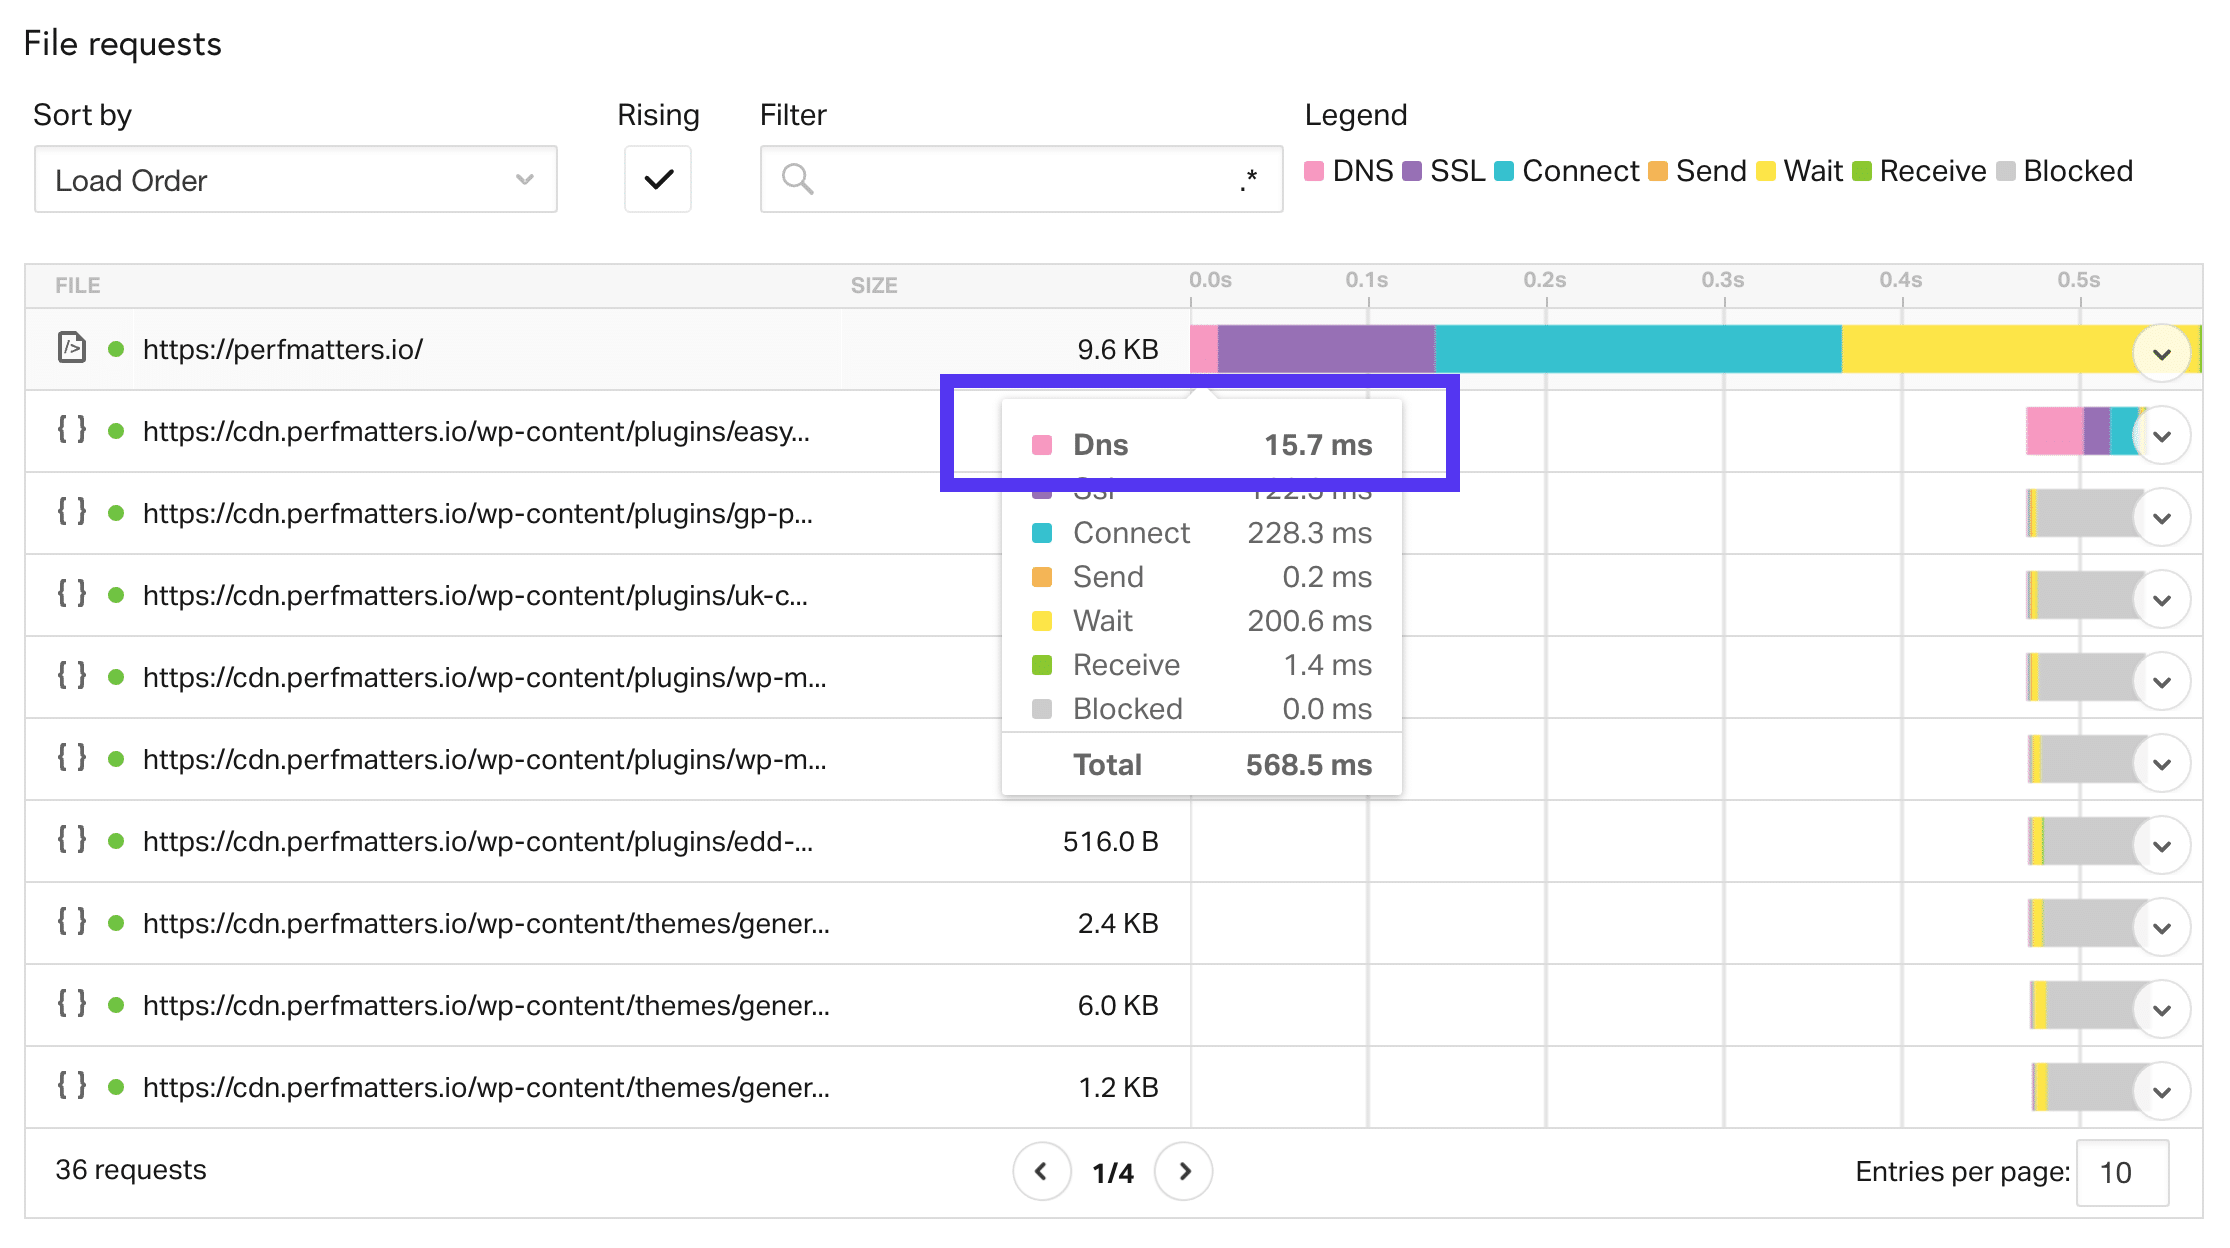
has been tested many times. One of these is if you are using a content delivery network (CDN). For those who are not familiar with CDN, it is a global network of servers that caches your content (JS, CSS, images, etc.) closer to your visitors. When you first run your Web site through Pingdom, it may have to get the latest assets from CDN. CDN caching works very much like DNS, and once cached, it is much faster when loaded continuously. Another
trick to speed up DNS is to use DNS prefetching. This allows the browser to perform a DNS lookup on the page in the background. You can do this by adding some lines of code to the title of the WordPress site. See some examples below.
or, if you are running WordPress 4.6 or later, you may need to use resource prompts. Developers can use

filters to add custom domain names and URLs as
,
,
or
. Thewp_resource_hintsSSL (purple)dns-prefetchpurple status color represents the time it takes for the browser to perform the SSL/TLS handshake. Every time you run a Web site through HTTPS, it means that a SSL certificate is involved and extra time is required due to the encryption process (SSL/ TLS handshake). In our sample domain, we have a certificate on both the Web server and our CDN. Therefore, there is an SSL negotiation time for the initial HTML document loaded from the Web server and our assets. SSL load timepreconnectinprefetchPingdom although the overhead of running HTTPS is small, because HTTP/2 is a new protocol that helps speed up the network, it is now negligible! HTTP/2 is required because browsers support HTTPS. It is also important forprerenderto note that even in 2018, not all vendors support HTTP/2. This includes both the network custodian and the CDN. So when you look around for hosting and CDN, make sure both support it!
By mid-2018, Pingdom had finally upgraded their tools to use Chrome 60 and later. You can
to see what is in use in the request header. In the past, they didn’t support HTTP/2 until version 49 using Chrome 39Magic Chrome. So we are pleased to say that the Pingdom tool now shows all the advantages of HTTP/2 when running tests!
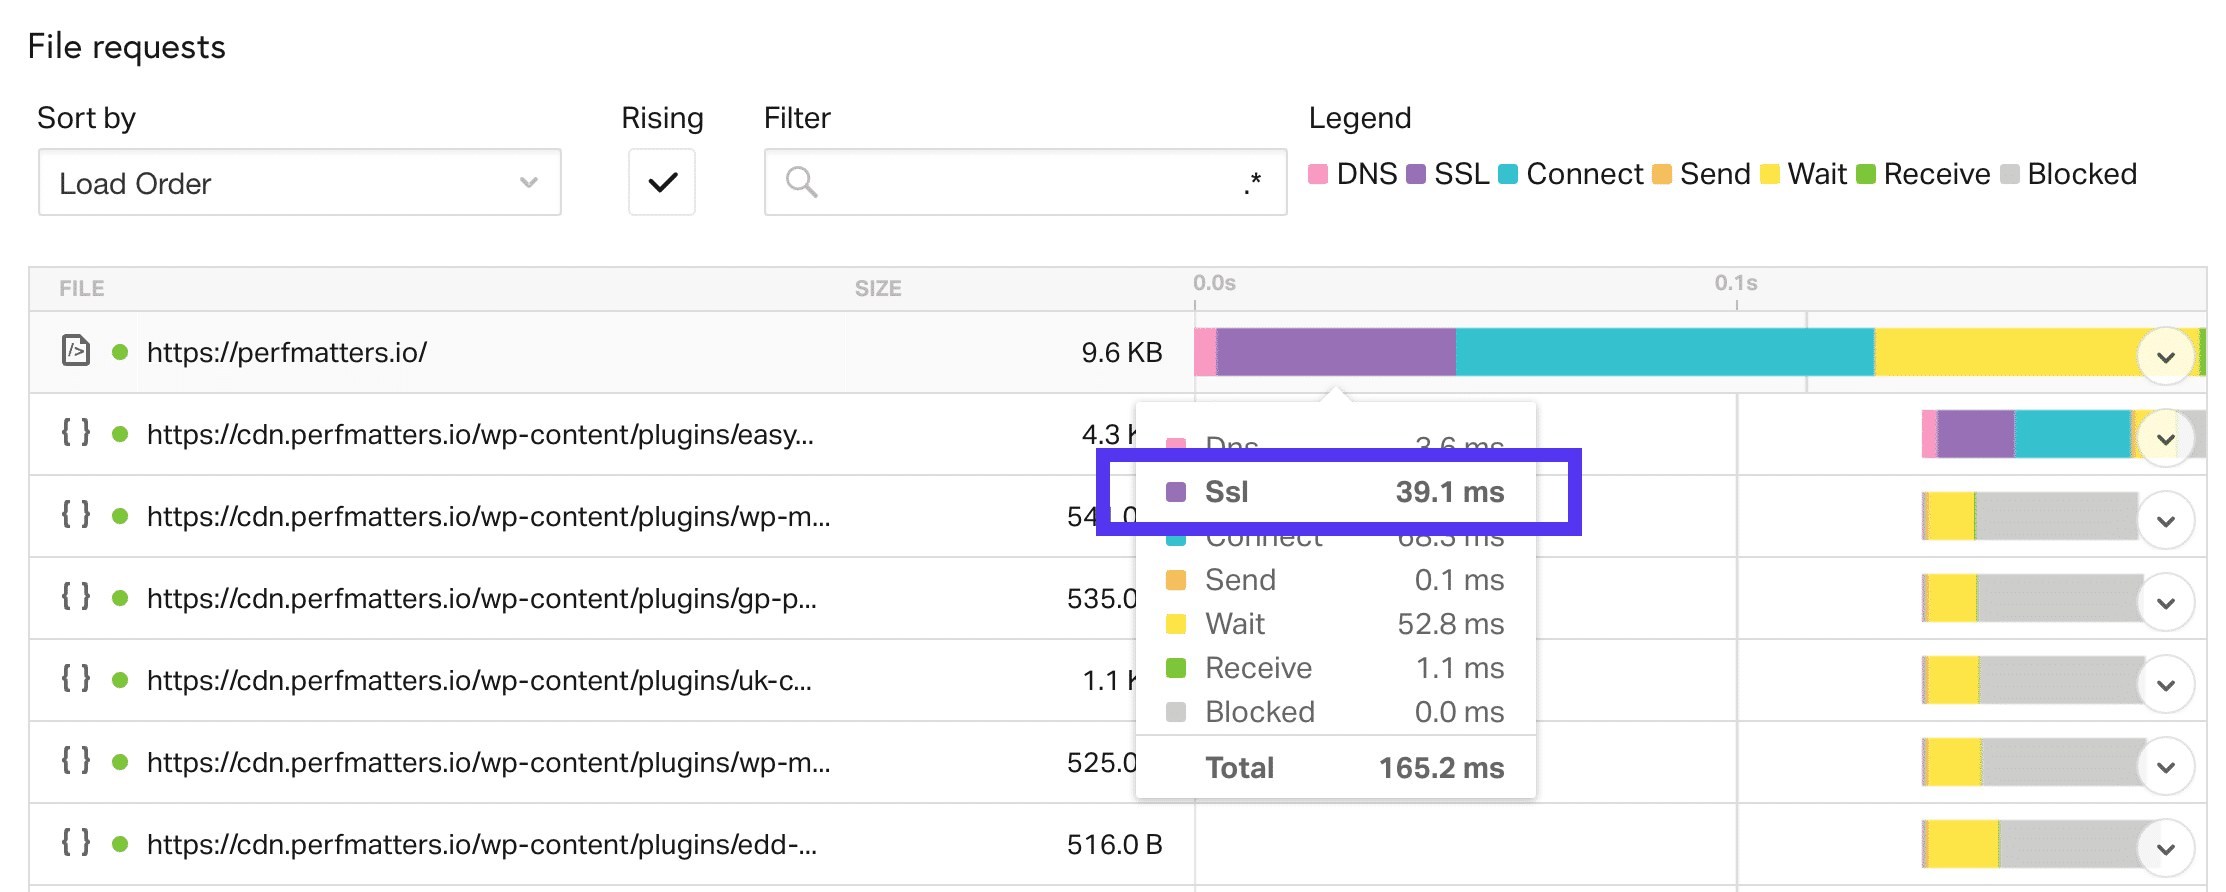
Pingdom supports HTTP/2
connections (turquoise) connection time in
Pingdom is the total time required to create a TCP connection or a TCP connection. You don’t really need to know how it works, but this is just a method of communication that must occur between the host / client and the server.
Pingdom connection timeuser-agentwait (yellow) wait time in

Pingdom actually refers to the first byte time, which is also called TTFB in some tools. TTFB is a measure of the responsiveness of Web servers or other network resources. In general, anything below 100ms is acceptable and is a good TTFB. If you approach the range of 300-400 milliseconds, your server may be misconfigured, or it may be time to upgrade to a better network stack.
wait time-what is the easiest way for TTFB
to reduce TTFB? The two best methods are effective WordPress caching and CDN. So let’s run a few tests.

TTFB
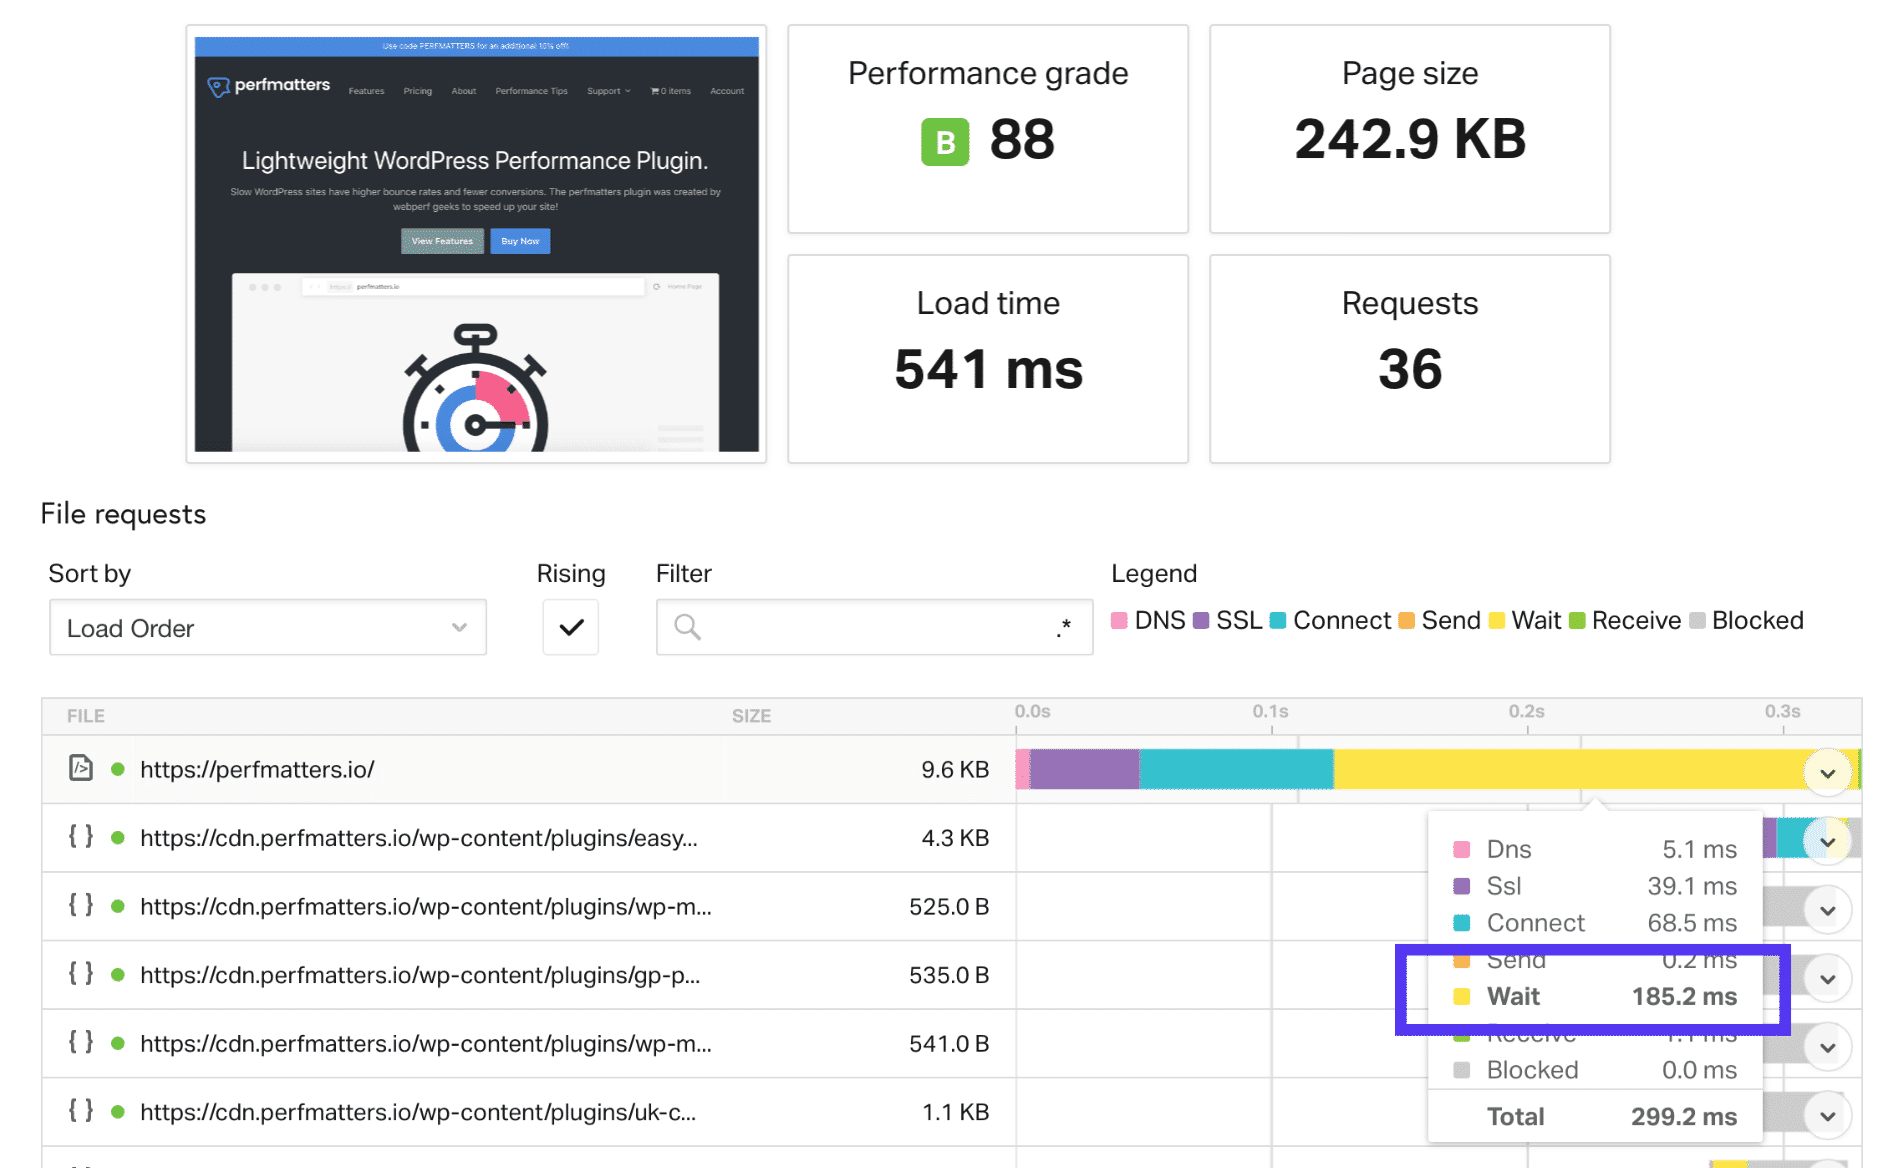
without WordPress host cache after clearing the cache on the WordPress website, we first tested it. This means that it must preload the cache again. As you can see, our total load time is 541ms, and the TTFB (wait time) of the initial request is 185.2 Ms.
Pingdom TTFB
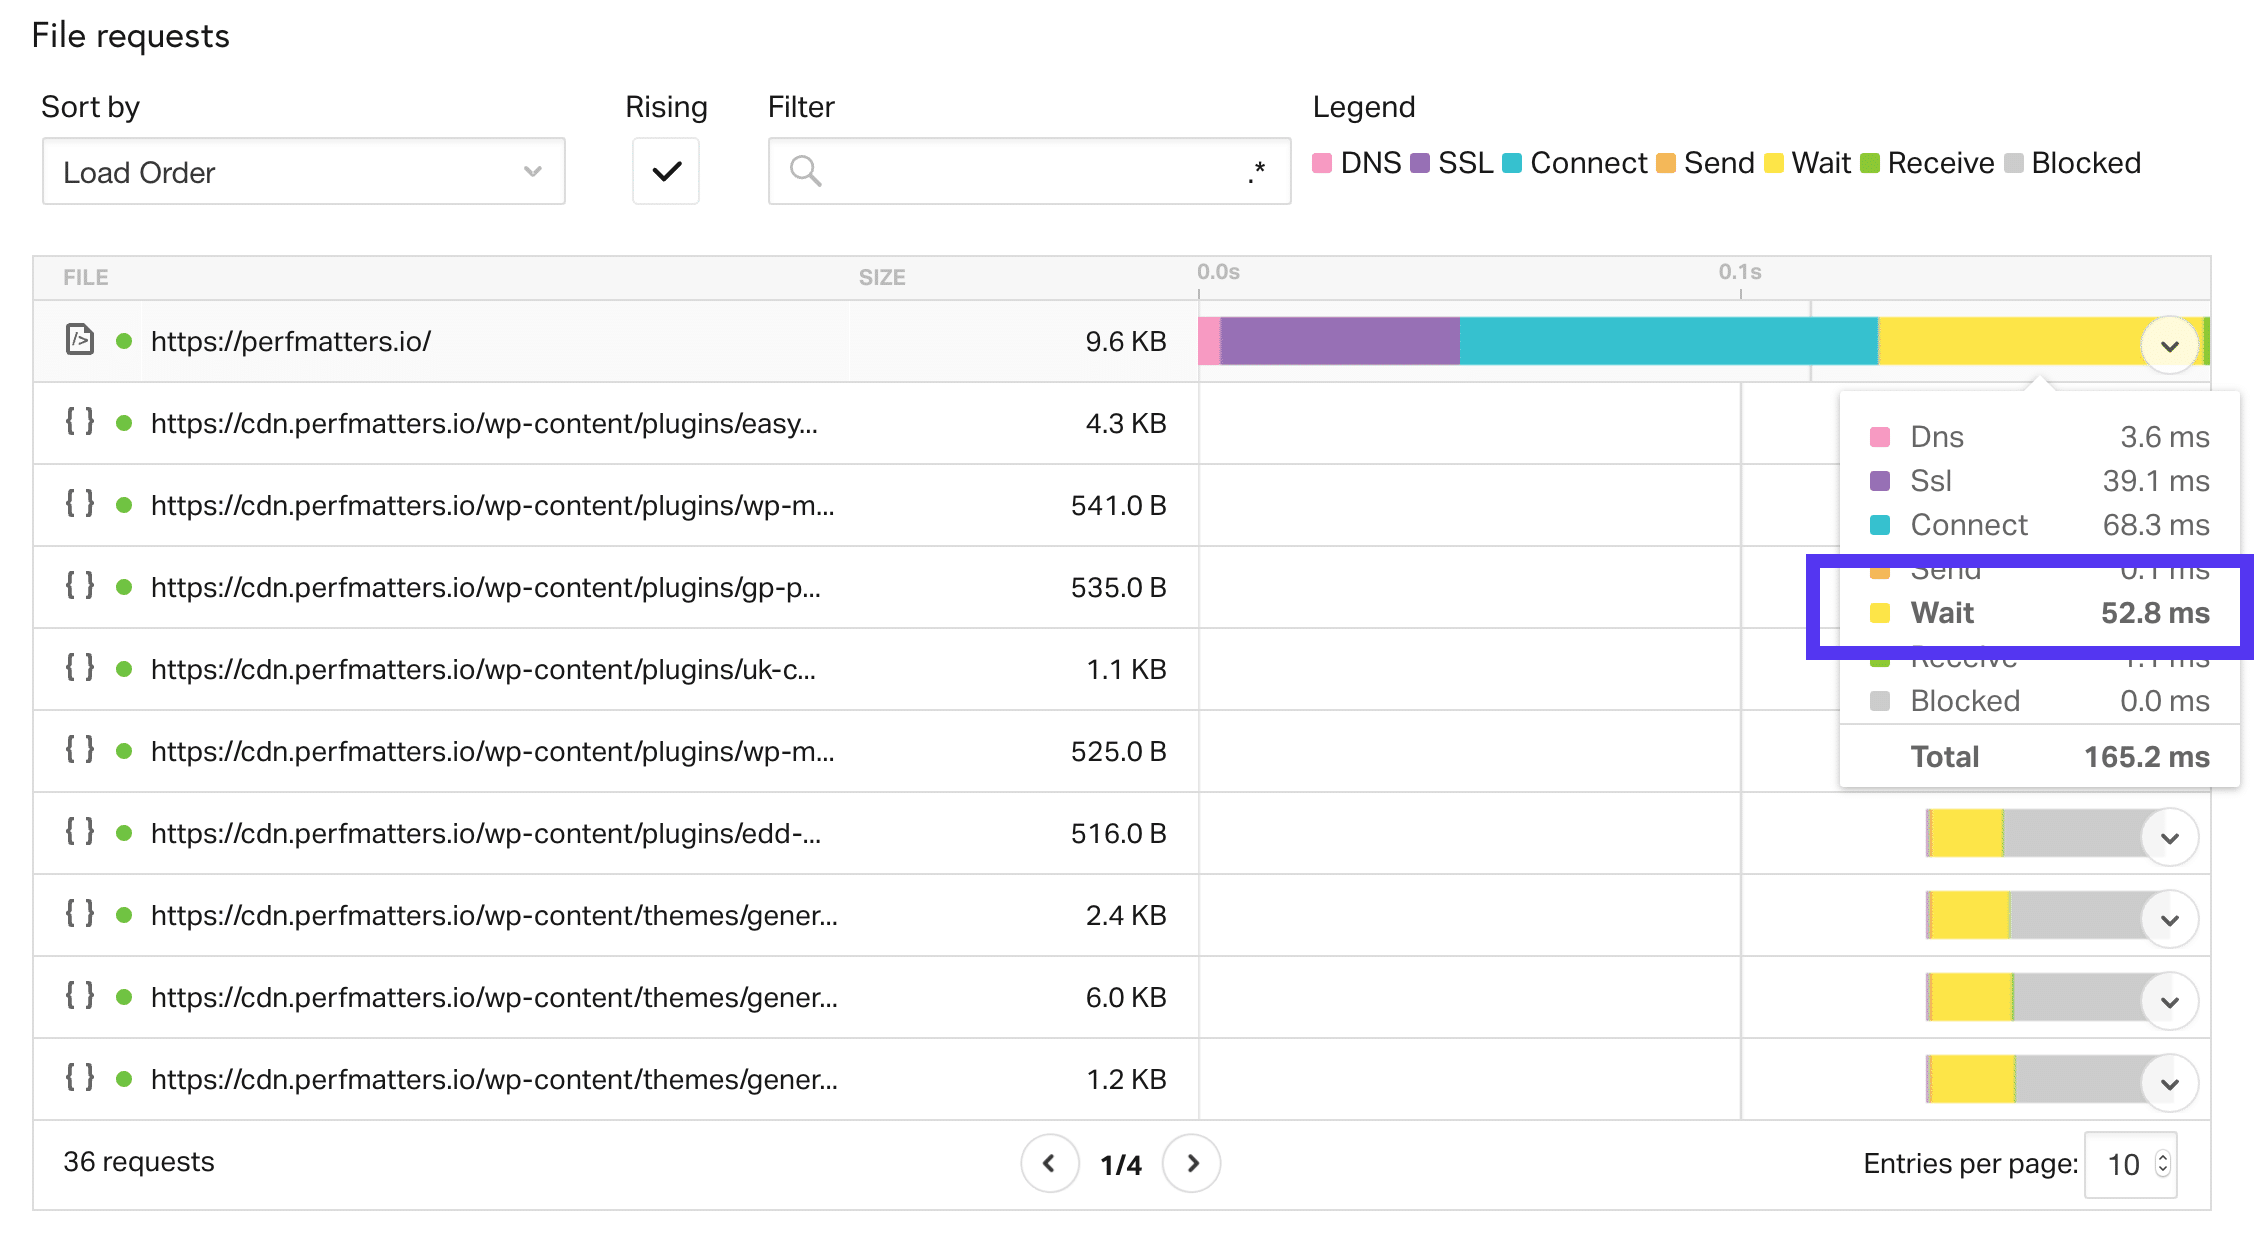
without WordPress cache TTFB
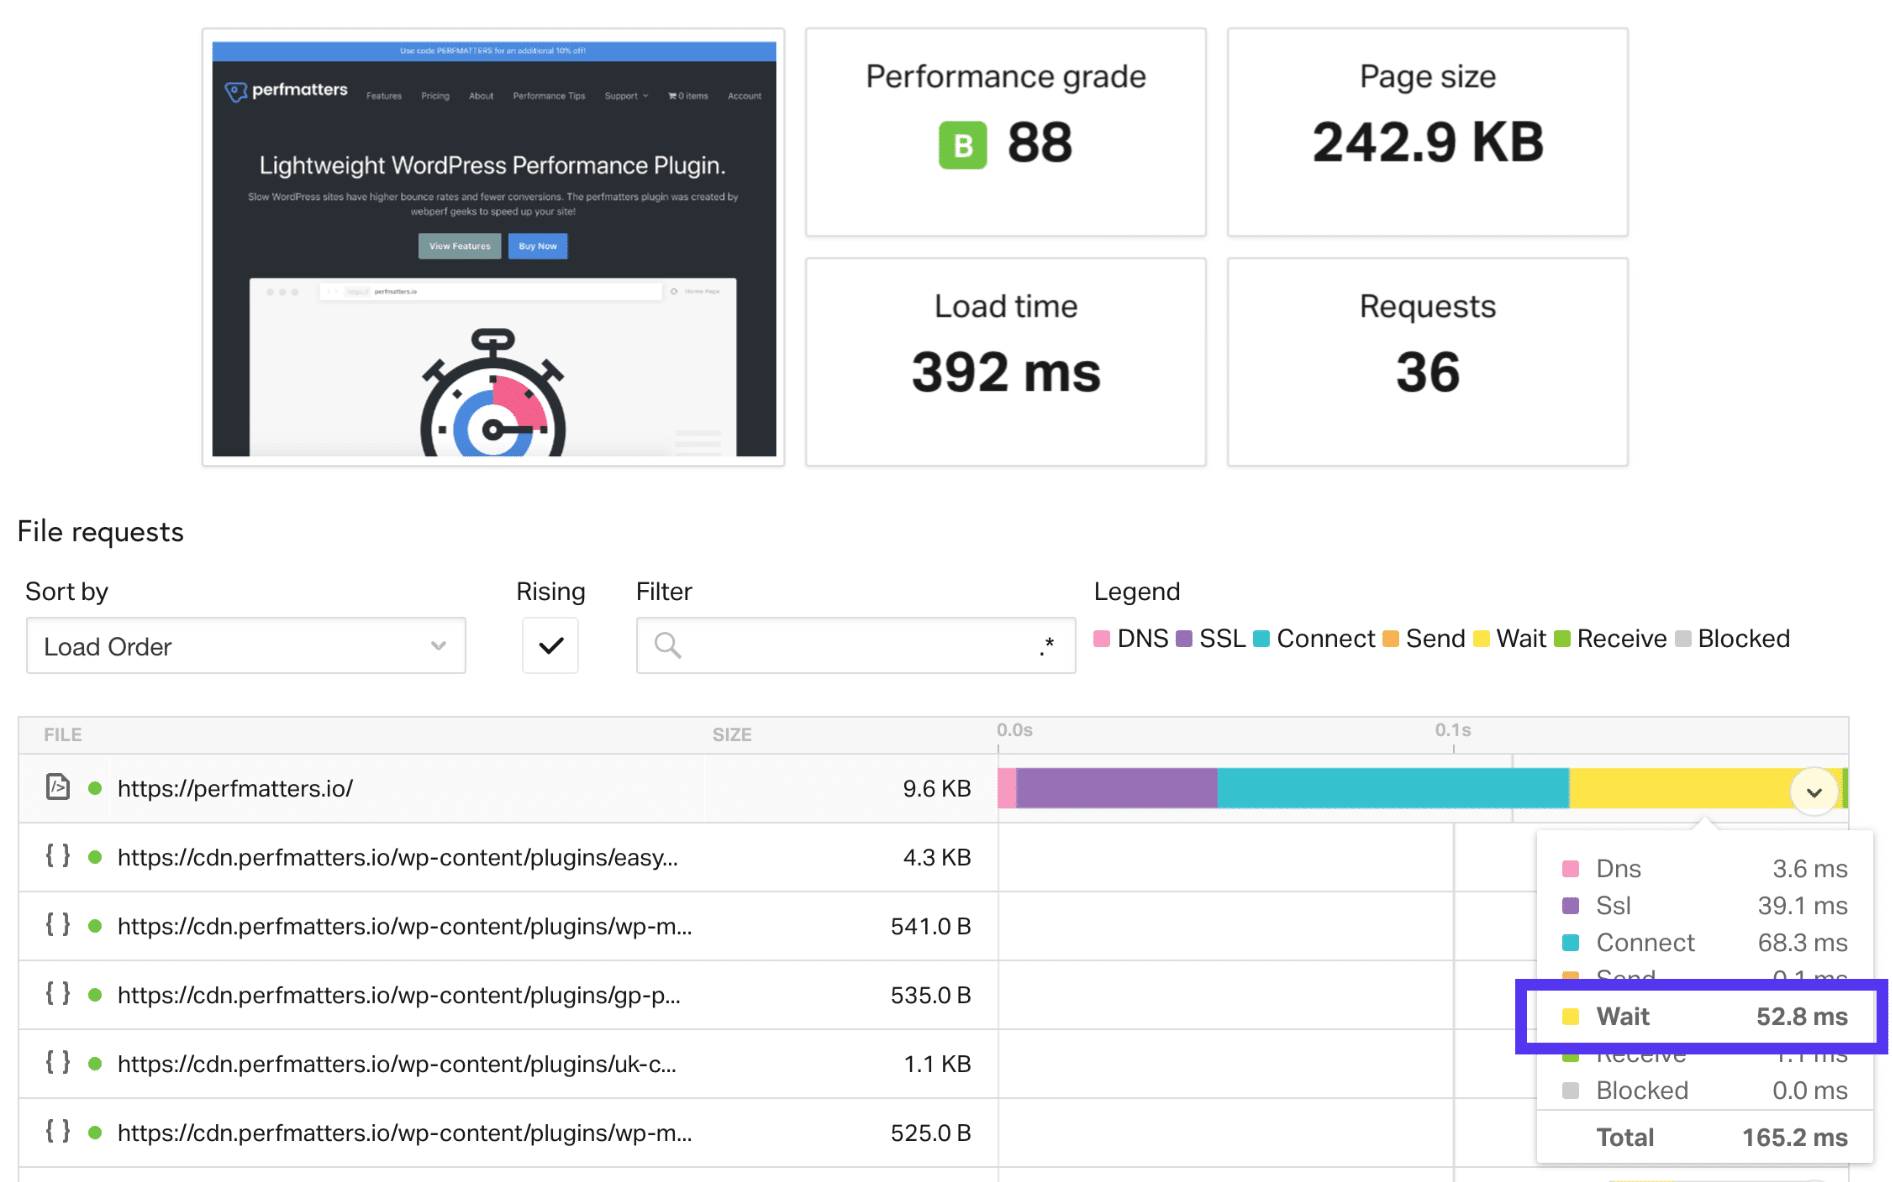
with WordPress host cache and then we run the test again. It now provides services directly from the cache. As you can see, our total load time has dropped to 392ms, and the TTFB of the initial request is now 52.8ms! This is the difference in caching.
Pingdom TTFB
with WordPress cache if your site serves visitors from different parts of the country or around the world, another easy way to significantly reduce TTFB is to use CDN. We did some tests again to show the differences.
does not have TTFB
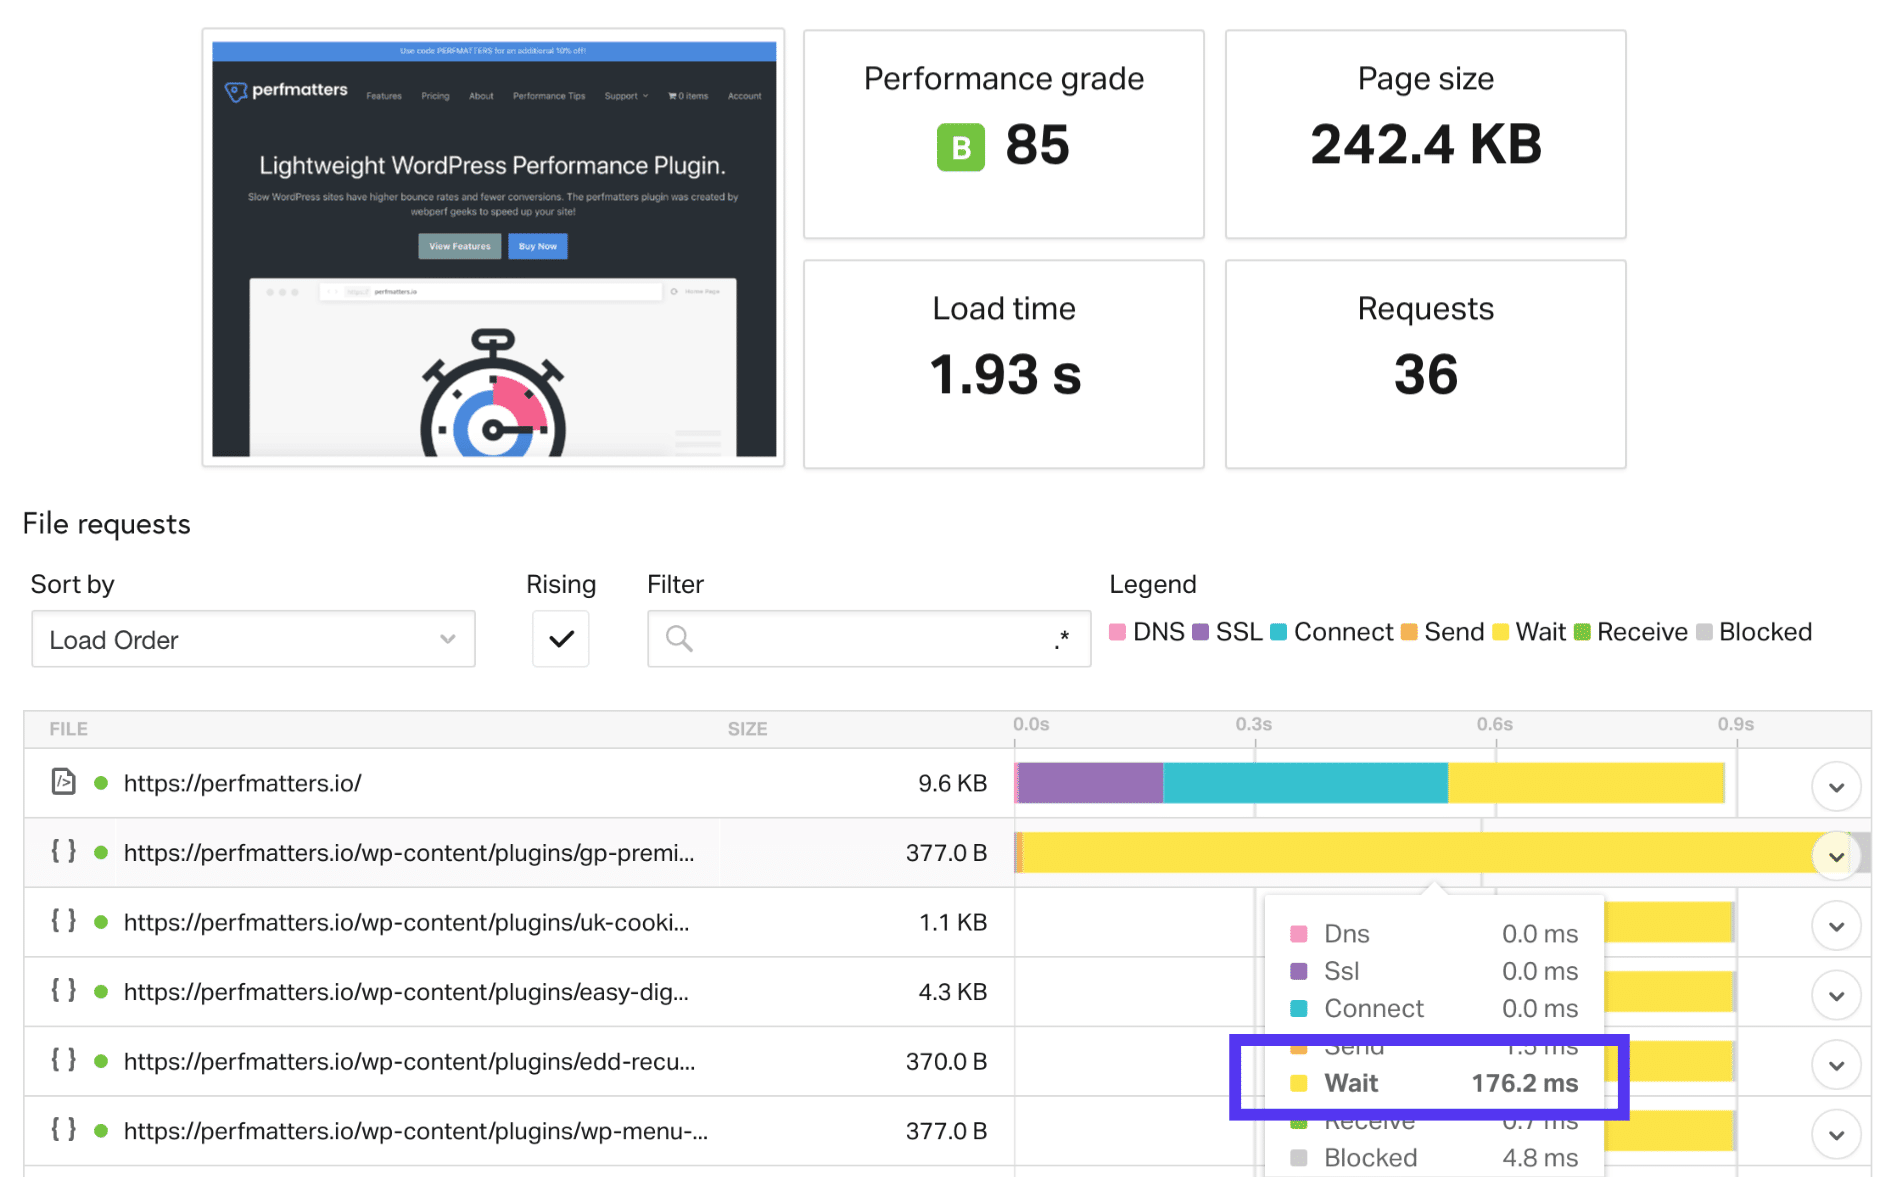
for CDN. We first run the test with CDN disabled. As you can see, our total load time is 1.93 seconds, and the average TTFB of the asset is about 176ms.
does not have TTFB
for CDN with TTFB
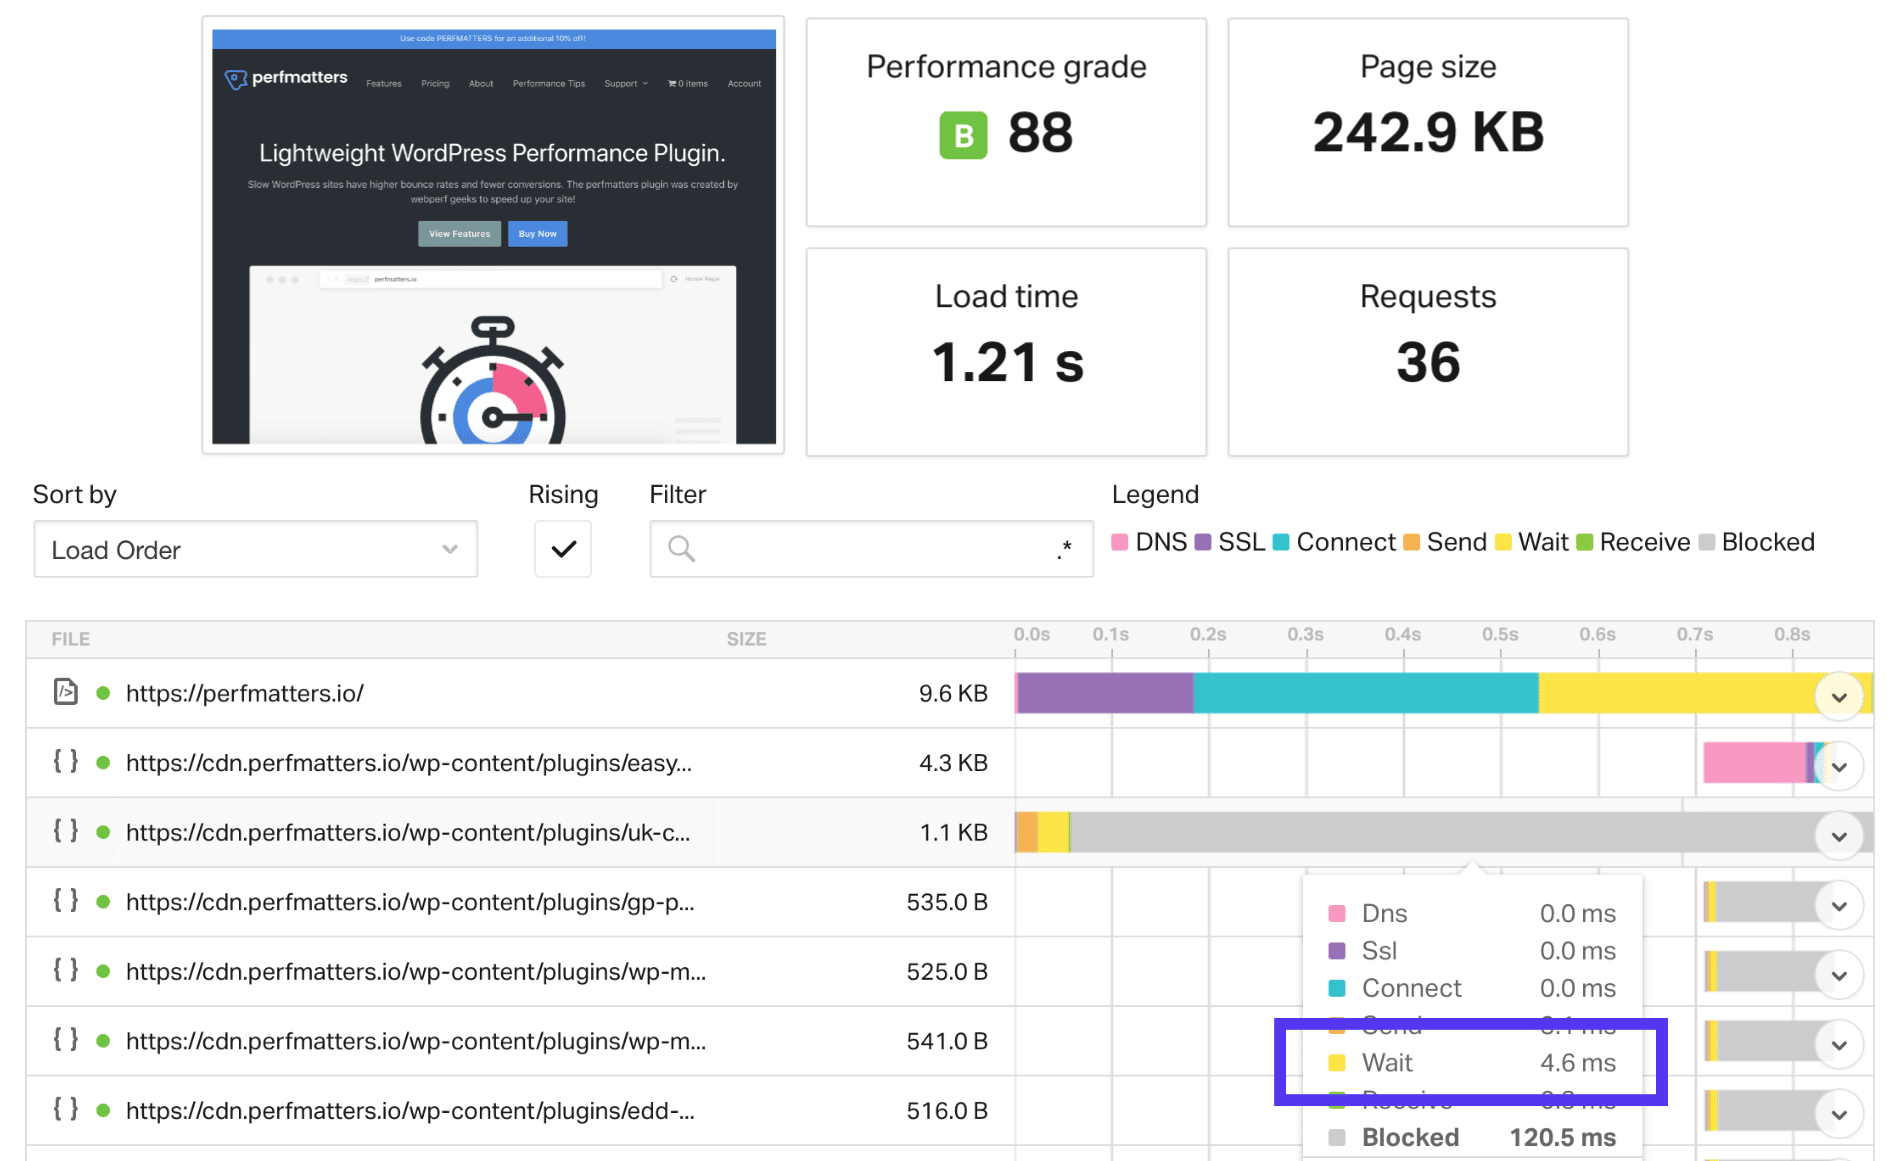
for CDN and then we enable CDN and run the test again. As you can see, our total load time has dropped to 1.21 seconds, and our average TTFB on CDN assets is now 4.6 milliseconds! How much difference CDN can make.
‘s TTFB
with CDN proves how CDN caching can increase speed and reduce TTFB.
of course, a good WordPress host with a well-thought-out architecture is also critical to reducing TTFB. The send and receive status in
send (orange) and receive (green)
Pingdom really doesn’t need much explanation. The send time is just the time it takes the Web browser to send the data to the server. The receiving time is the time it takes for the web browser to receive data from the server. In your tests, both are usually very low or non-existent.
HTTP response header
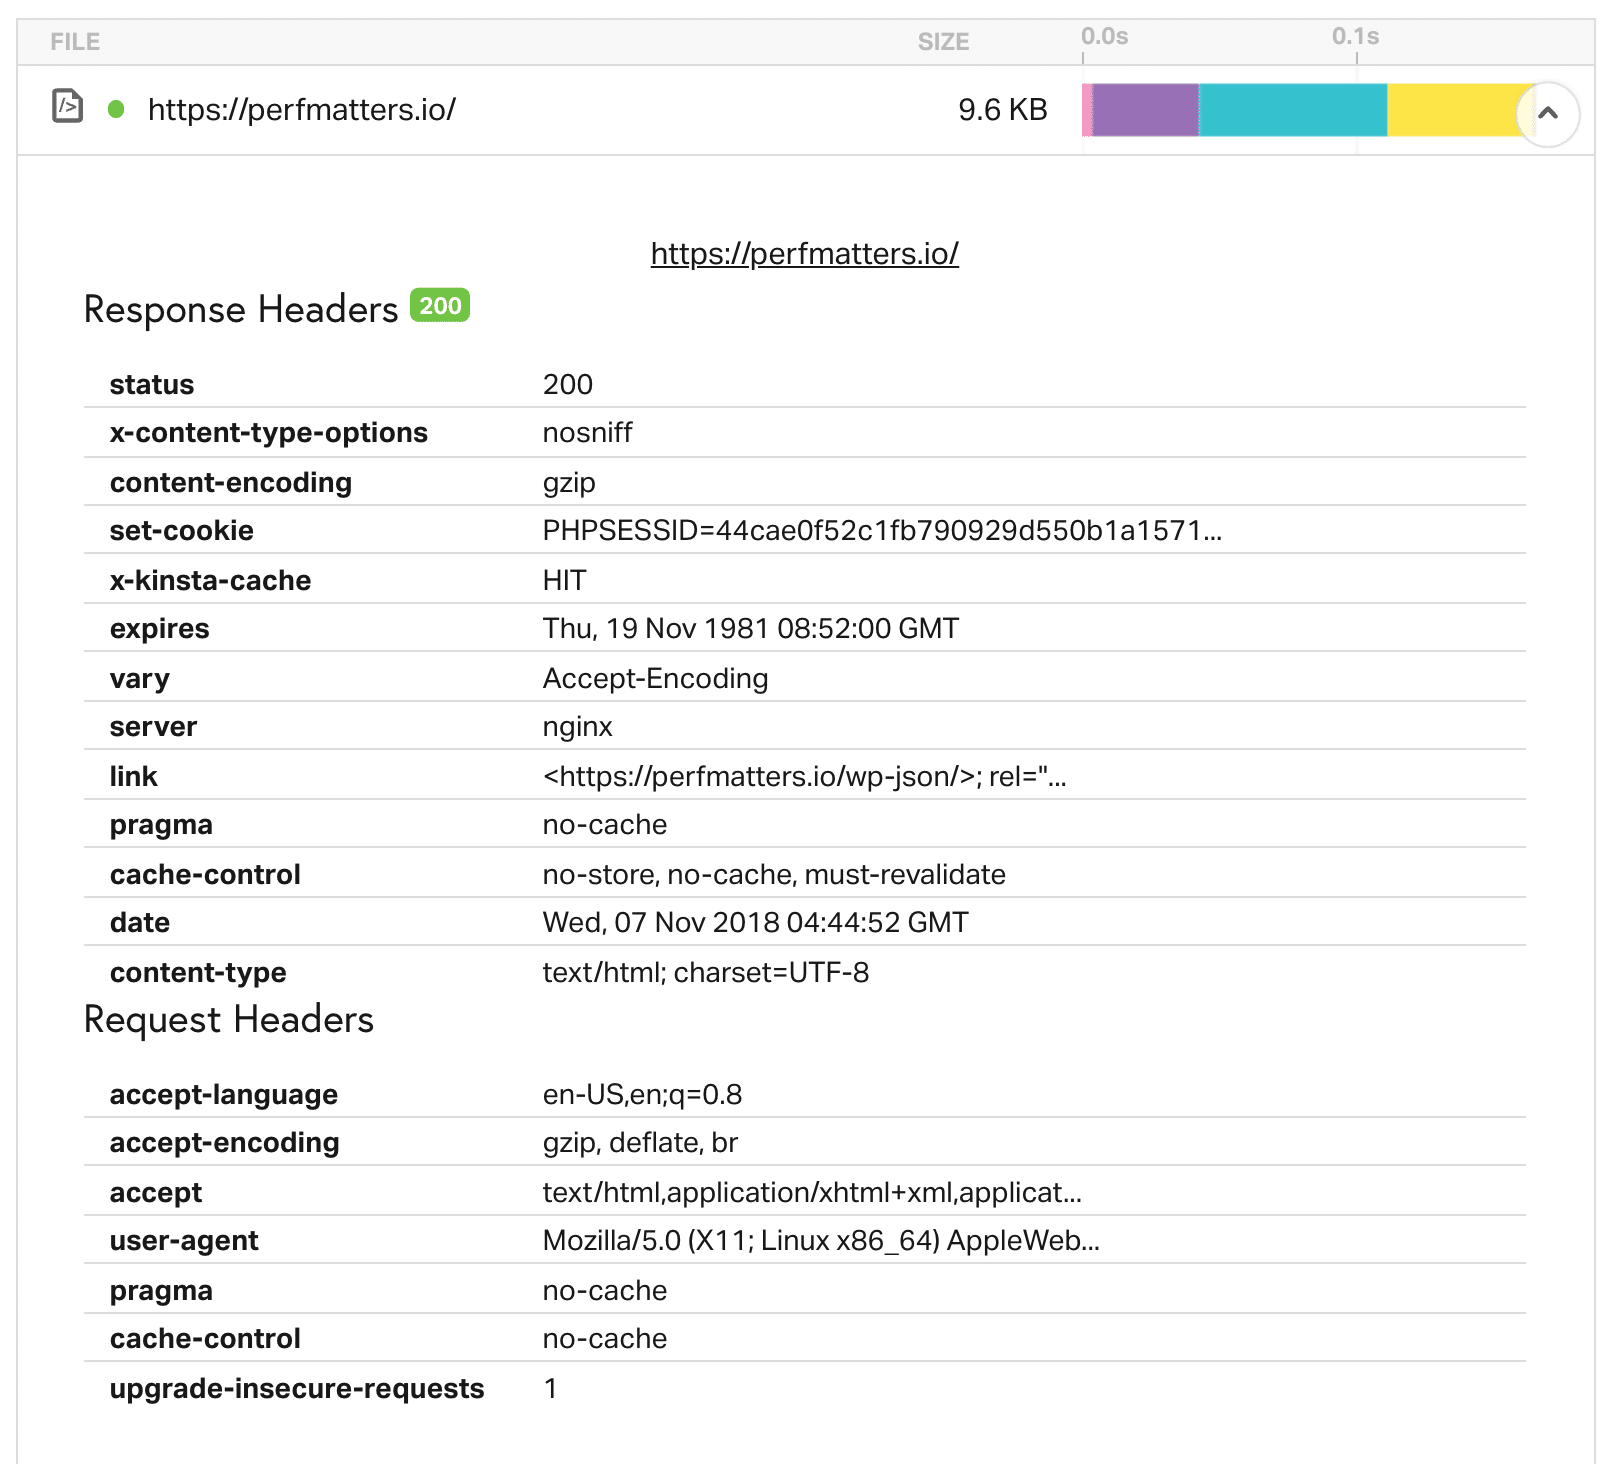
you can also click on a single request and view the HTTP response header while doing waterfall analysis. This provides valuable information. In the following screen, we can immediately see things such as gzip enabled on the Web server, and it is provided from the cache (HIT, otherwise MISS will be displayed), cache control headers, expiration headers, browser user agents, and more.
HTTP response header
Case study domain configuration
if you learned more about this in our waterfall analysis post, you will feast your eyes. It’s always annoying to see people share skills and case studies, but not how they got there. So here is our exact configuration of the case study domain used above! Copy it at will. The
case study domain (perfmatters.io) is hosted on Google Cloud Platform in the United States (Council Bluffs (us-central1), Iowa, USA). There are currently 28 different data centers to choose from. GCP’s advanced network is included in all plans for lightning-fast network latency. The
Web server uses HTTP/2, Nginx, and MariaDB, all of which help speed up the load time.
this site is using KeyCDN, which supports CDN. Free CDN bandwidth is included in all hosting plans.
this site does not use any caching plug-ins. Caching everything at the server level greatly simplifies things!
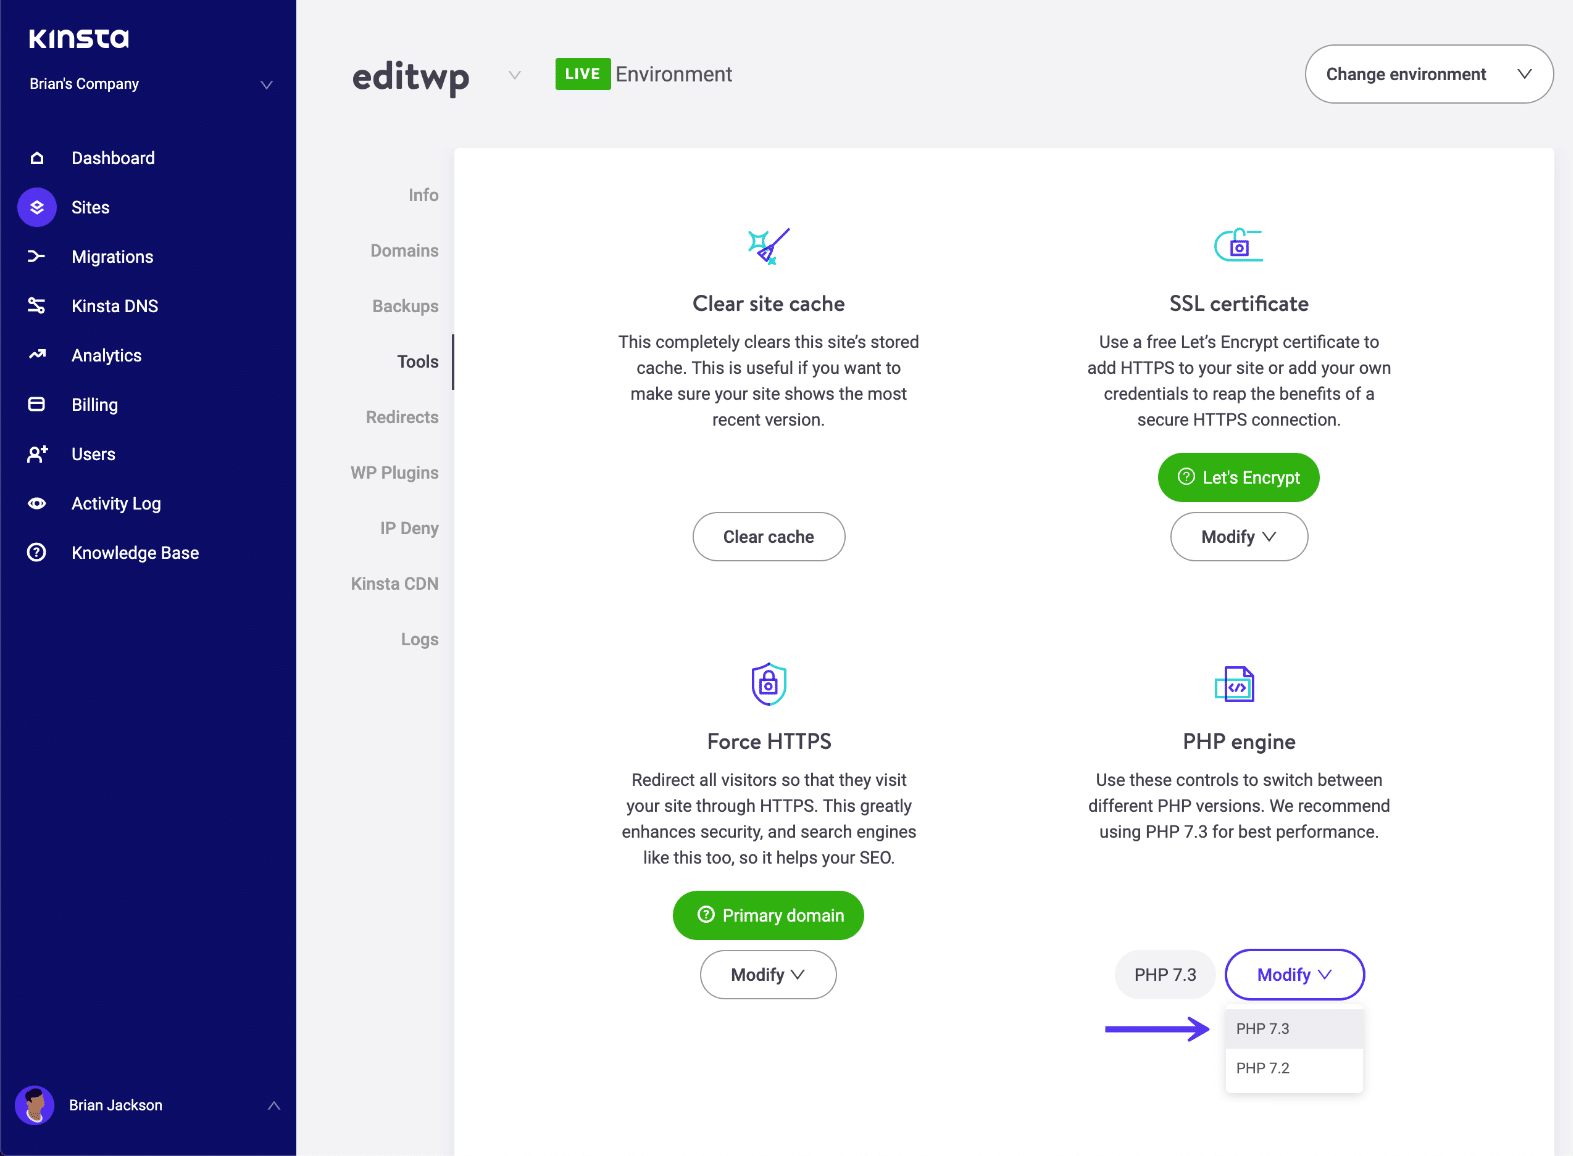
this site uses PHP 7.3. Newer versions of PHP always show significant performance improvements.
Architecture
- updates the PHP version of the WordPress website the
- WordPress plug-in and theme
- the following is a list of plug-ins that affect the performance used on the WordPress e-commerce site.
- advanced Perfmatters plug-in. This removes unnecessary HTTP requests such as embedding, emoticons, and a script manager to enable / disable certain scripts to load on a per-page / post / site-wide basis. The
- advanced Imagify plug-in is used to compress images.
‘s free Safe SVG plug-in is used to upload SVG images to the WordPress site. The
advanced WordPress theme GeneratePress is used to build EDD sites.
further read the recommended tutorial: how to remove blocking rendering JavaScript and CSS
- how to disable WordPress emoji
- how to disable WordPress embedding
- how to achieve WordPress website Google PageSpeed Insights test full score summary
- as you can see, understanding how Pingdom speed testing tools work better and the meaning of all charts can help you make more data-driven decisions about performance. We call it waterfall analysis, and it’s important to understand how your personal assets are loaded and how they are affected by your WordPress host, physical location, CDN, and so on.
进一步阅读的推荐教程:
- 如何消除阻塞渲染的JavaScript和CSS
- 如何禁用WordPress表情符号
- 如何禁用WordPress嵌入功能
- 如何实现WordPress网站的Google PageSpeed Insights测试满分
小结
如您所见,了解Pingdom速度测试工具如何更好地工作以及所有图表的含义可以帮助您在性能方面做出更加数据驱动的决策。我们称之为瀑布分析,了解您的个人资产如何加载以及它们如何受到您的WordPress主机、物理位置、CDN等的影响至关重要。

